
In this article
Choose a BI tool around who prepares the data, who reads the reports, and where the data lives. Power BI is a useful starting point for Microsoft reporting teams; Tableau emphasizes visual exploration; Looker suits teams that want shared, centrally maintained metric definitions. Embedded and industrial analytics introduce different requirements again.
Business intelligence (BI) software connects business data to reports and interactive dashboards. It can make a revenue trend easier to investigate, but the team still has to define revenue, reconcile the source data, and decide who may see it.
The ten profiles below compare those choices and their published commercial conditions. They are not a speed or accuracy ranking. Pricing was checked on September 18, 2026; figures are in US dollars unless stated otherwise.
Start with the reporting job
A sales manager who reads a weekly dashboard needs different permissions from an analyst who builds its data model. Before requesting a demo, write down:
- Authors and readers: how many people create reports, edit them, or only view them?
- Data location: spreadsheets, a cloud warehouse, operational databases, or a mixture?
- Freshness: is a daily refresh enough, or must new transactions appear within minutes?
- Distribution: internal dashboards, scheduled PDFs, or analytics inside a customer-facing app?
- Ownership: who fixes a failed refresh, changes a metric definition, and removes access?
“Real time” depends on the connection mode, source system, refresh configuration, and purchased capacity. Test that entire path instead of assuming every dashboard is continuously live.
Ten BI platforms and where they fit
1. Microsoft Power BI: reporting in the Microsoft stack
Power BI combines data preparation, modeling, and interactive reporting. It is a practical shortlist candidate when Excel, Microsoft 365, and Azure already form part of the reporting workflow.
- Strength: analysts can build a reusable data model and distribute reports through the Power BI service, rather than circulating separate spreadsheet copies.
- Trade-off: a free authoring tool does not mean free private sharing. Report creators and readers need the appropriate licenses or a qualifying capacity arrangement. Model design and source performance still matter.
Power BI Pro is $14/user/month, paid yearly; Premium Per User is $24/user/month, paid yearly. Pro is included in Microsoft 365 E5 and Office 365 E5. Check existing entitlements before purchasing more seats.
2. Tableau Cloud: interactive visual analysis
Tableau Cloud is the hosted Tableau offering. Its Creator, Explorer, and Viewer roles distinguish people building data sources and workbooks from people exploring or reading published dashboards.
- Strength: a team can give readers interactive dashboards while reserving broader authoring permissions for analysts. Tableau Pulse adds a way to follow defined metrics.
- Trade-off: the entry Viewer price is not the cost of a complete deployment. Every deployment needs at least one Creator, and additional management or AI capabilities depend on the edition.
Tableau Cloud Standard lists Creator $75, Explorer $42, and Viewer $15 per user/month, all billed annually. Enterprise lists $115, $70, and $35, respectively. Cloud+ and the Tableau+ Bundle require a quote. Do not substitute Tableau Server or Tableau Next pricing for a Cloud deployment.
3. Microsoft Fabric: a broader data platform
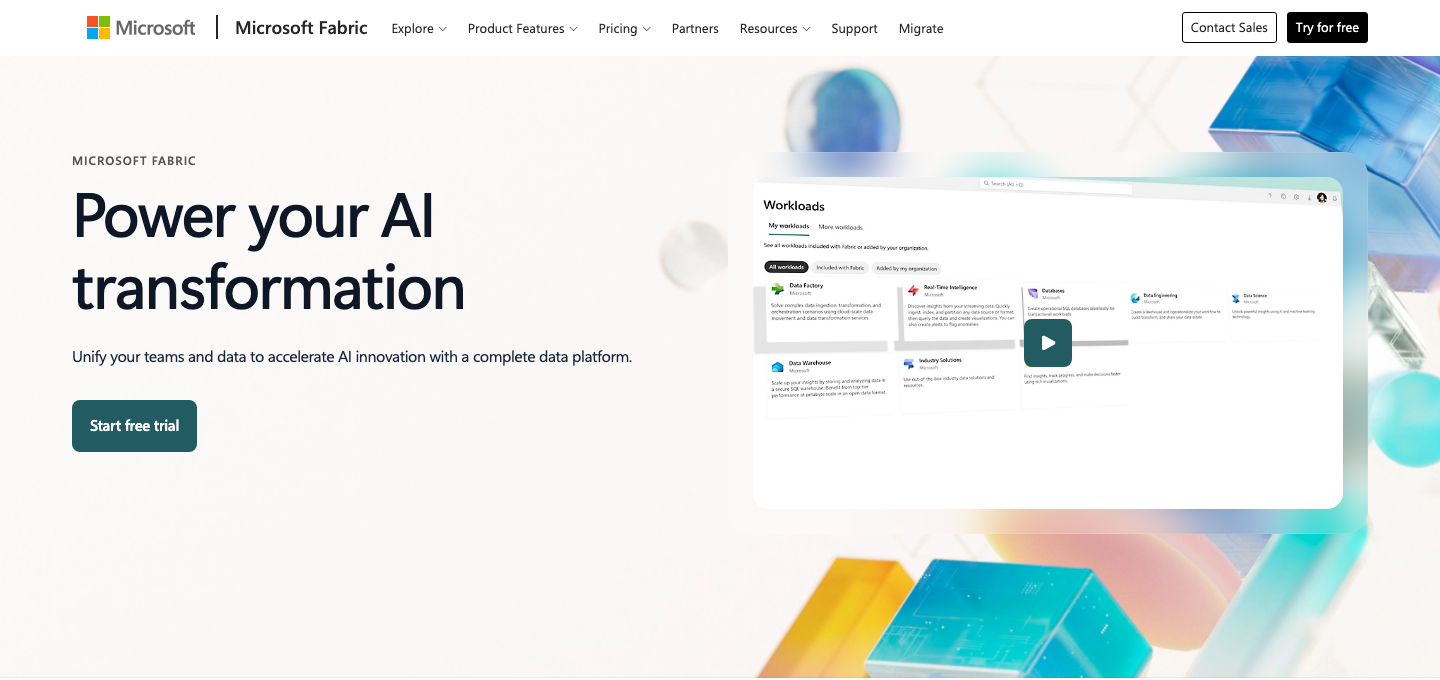
Fabric is relevant when the project includes ingestion, data engineering, a warehouse or lakehouse, and reporting. Power BI is part of Fabric, so these are overlapping purchase decisions rather than two unrelated dashboard products.
- Strength: shared OneLake storage and a common platform can connect data preparation with the reports that consume it.
- Trade-off: capacity, storage, workload demand, and Power BI user licensing must be budgeted together. A Premium Per User license alone does not provide Fabric capacity for non-Power BI workloads.
Fabric pricing depends on region and capacity, with pay-as-you-go and reservation options. Microsoft’s licensing guide explains the F64-or-larger capacity condition for eligible free viewers of Power BI content. Creators still need the applicable paid user license. The 60-day trial has feature exclusions, including Copilot; do not treat a trial as permanent production capacity.
4. Qlik Cloud Analytics: associative data exploration
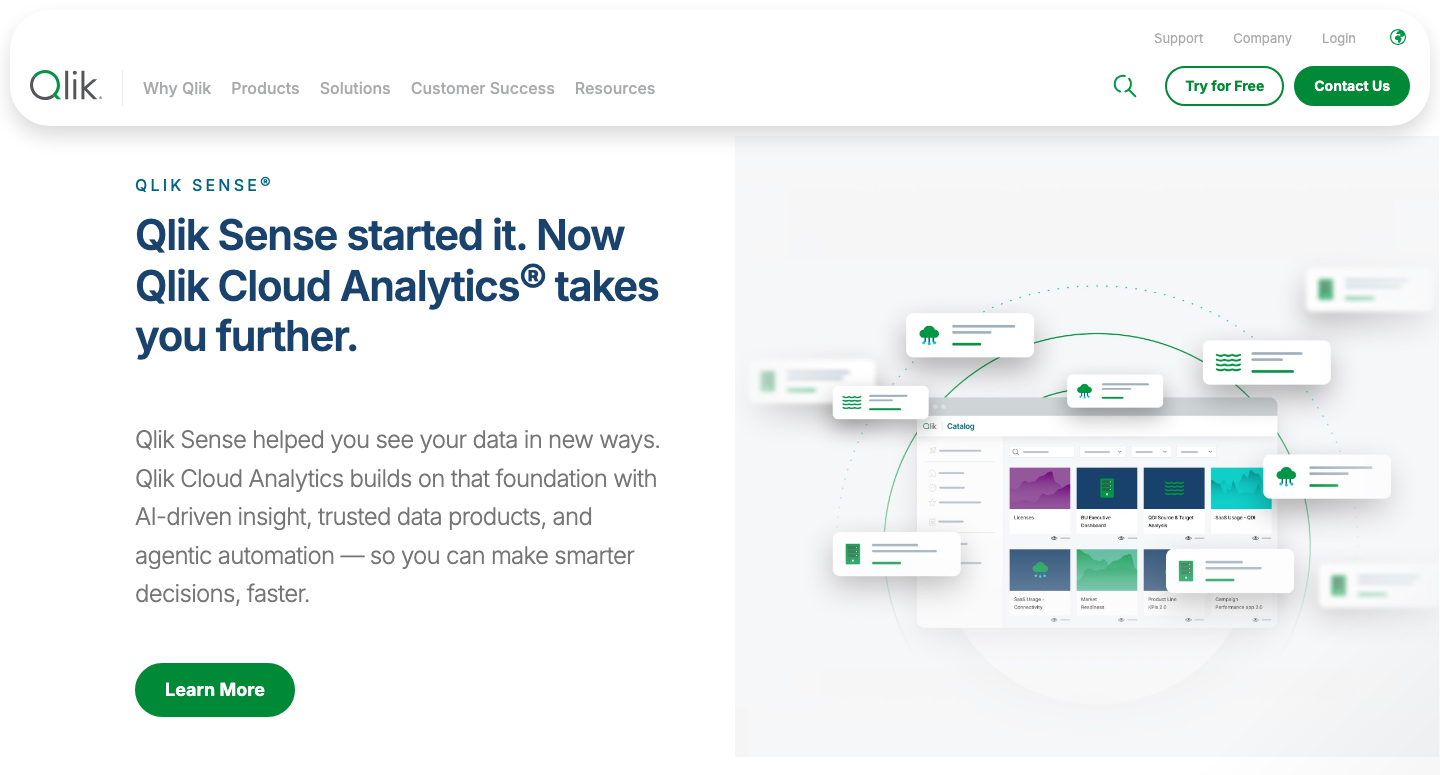
Qlik’s associative approach lets users select values and explore relationships across a prepared data model. The current Qlik Sense product page directs new evaluations toward Qlik Cloud Analytics; existing Qlik Sense deployment terms need a separate check.
- Strength: linked selections can help analysts investigate how a customer, product, or region relates to other data in the model.
- Trade-off: someone still has to prepare that model. In the cloud plans, data capacity and app-size limits can matter as much as the number of people using a dashboard.
Starter starts at $300/month, billed annually, including ten users and a fixed 10 GB of data for analysis. Additional users can be purchased, but additional data capacity is unavailable on Starter. Standard starts at $825/month for 25 GB, with no extra user charge; Premium starts at $2,750/month for 50 GB. Those starting prices also require annual billing.
5. Looker: shared metric definitions
Looker uses a semantic model: a maintained definition of business measures and their relationships. For example, a data team can define which orders count toward net revenue and make that definition available across reports.
- Strength: central definitions can reduce the need for each team to recreate the same calculation in its own dashboard.
- Trade-off: someone must own the model and its changes. Budget for the underlying warehouse and query workload as well as the BI subscription.
Looker pricing combines a platform subscription and user licenses. Standard, Enterprise, and Embed require a sales quote and annual commitment; the platform includes ten Standard Users and two Developer Users. Looker Studio is a separate product, so its free offer is not a free tier of this Looker platform.
6. IBM Cognos Analytics: managed reporting
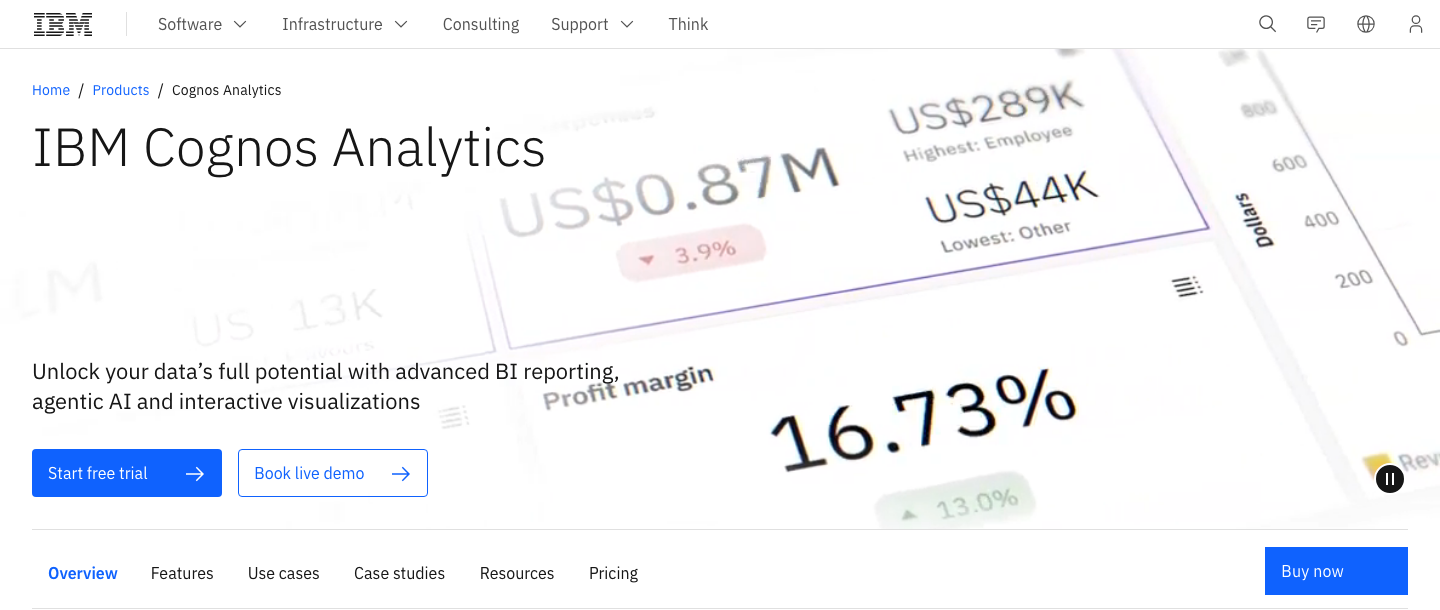
Cognos combines dashboards and analysis with structured reporting. It is worth evaluating when a report must be generated, scheduled, and distributed consistently, alongside interactive analysis.
- Strength: Premium includes report creation, execution, scheduling, and more advanced administration. IBM also documents on-premises, hosted, and container deployment options.
- Trade-off: the lowest on-demand tier does not include all reporting rights. Standard can receive reports; creating and scheduling reports requires Premium in the published on-demand comparison.
The live US pricing page displayed starting rates of $11.25/Standard authorized user/month and $44.90/Premium authorized user/month, excluding taxes and duties. These are indicative starting prices; confirm the billing term, annual offer, local availability, and renewal price. Other deployment models require their own quote.
7. Sisense: analytics inside an application
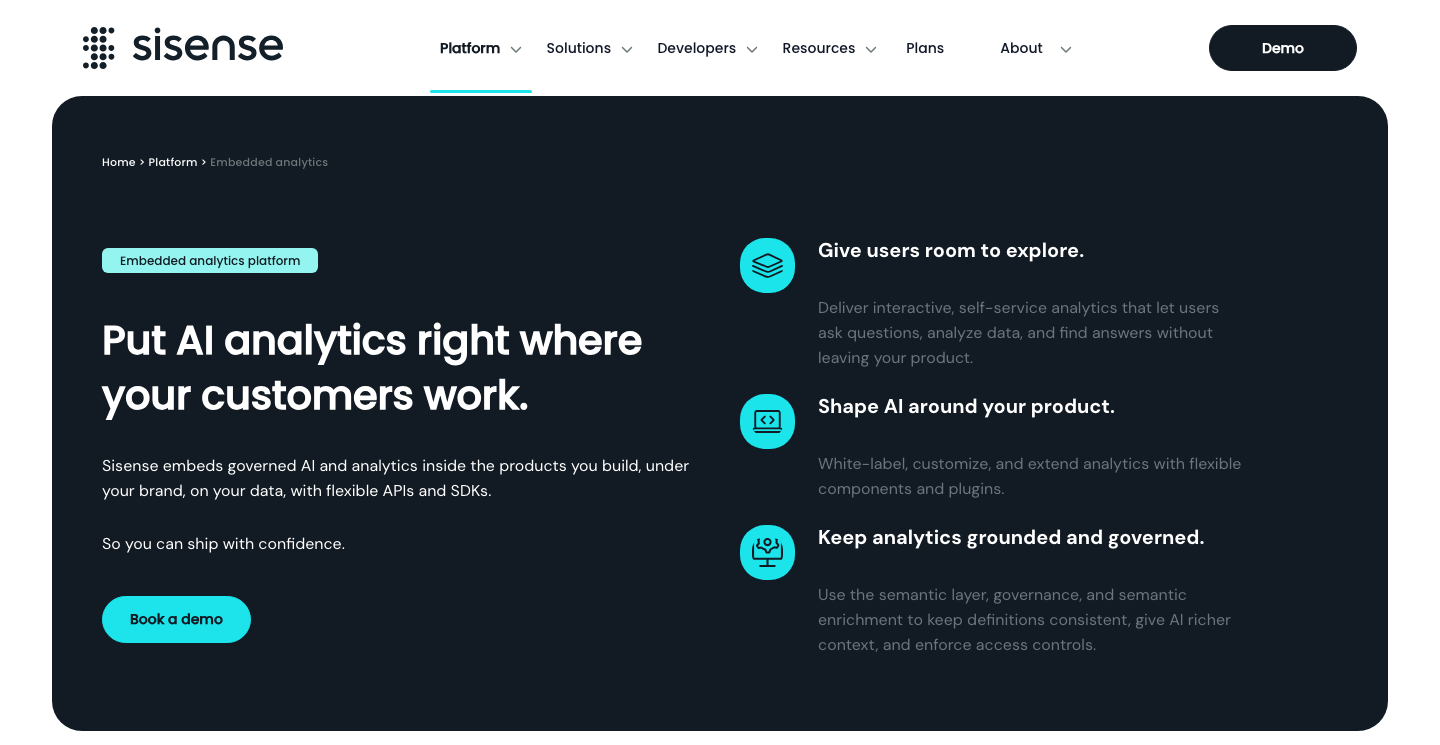
Sisense focuses on embedding analytics into software. Its iframe and Compose SDK approaches give product teams different ways to add dashboards or compose analytical interfaces within their application.
- Strength: developers can connect an analytics experience to the product’s own interface and customer context, instead of sending every user to a separate reporting portal.
- Trade-off: embedding is an engineering project. Tenant isolation, authentication, permissions, loading behavior, and upgrades need testing in your application.
The current plans page separates Self-serve and Enterprise. Enterprise deployment and support terms are customized. No numeric subscription rate was visible on that public page; request the billable units, included usage, trial conditions, and any implementation fees before comparing totals.
8. Spotfire Analytics: industrial data exploration
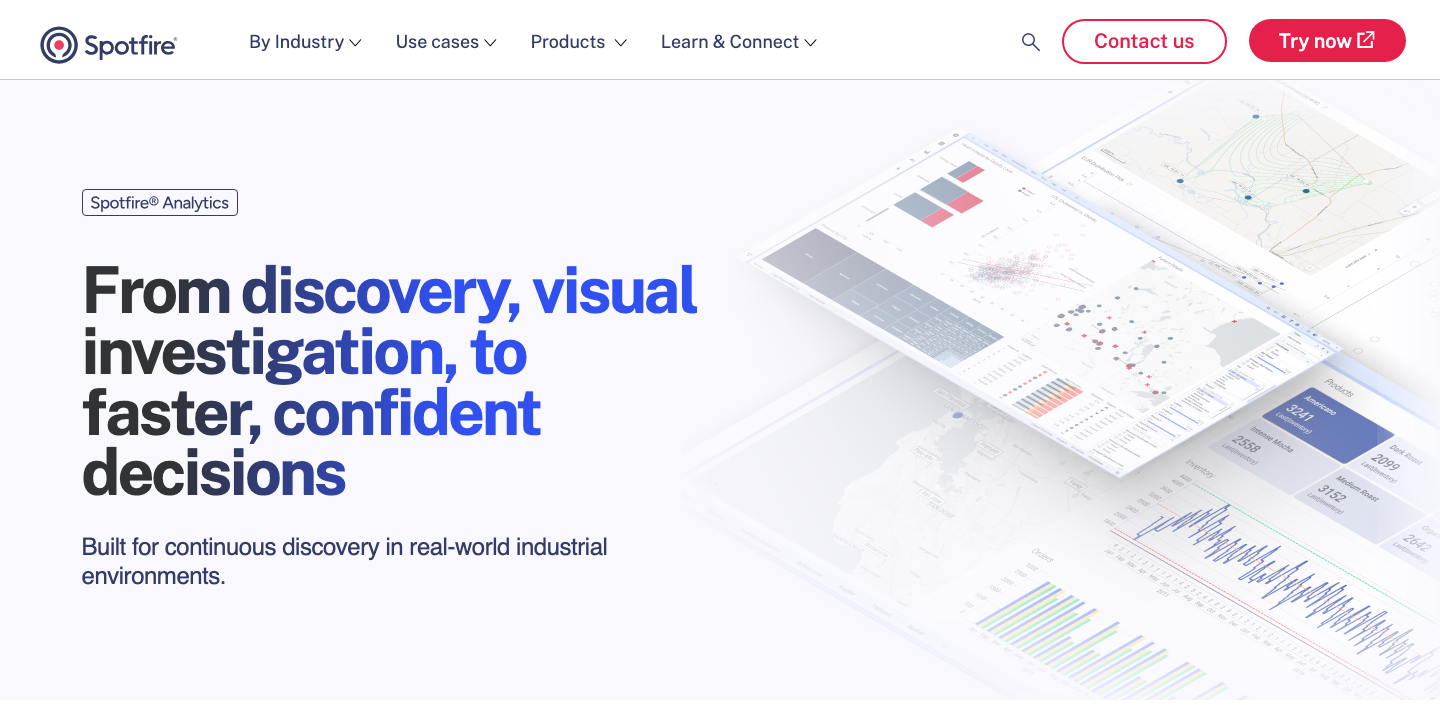
Spotfire Analytics is aimed at exploring complex operational and industrial data. Its current product page emphasizes investigating time-series, spatial, and multivariate relationships as questions change.
- Strength: this focus fits investigations such as comparing operating conditions with a quality change, where a fixed weekly dashboard may not answer the next question.
- Trade-off: data quality and domain expertise remain essential. A team buying only straightforward management reports should test whether the additional analytical scope is useful to its actual work.
Request a current quote for Analytics, Industry Pro, or Enterprise, specifying the deployment and user roles. A verifiable current price was unavailable in the reviewed purchase path. Old “Consumer,” “Business Author,” or “Analyst” prices should not be treated as today’s offer without vendor confirmation.
9. Yellowfin: dashboards with explanatory context
Yellowfin combines dashboards, data storytelling, and automated business monitoring. It is a useful candidate when the reporting problem includes communicating what changed and why it matters to colleagues.
- Strength: teams can put narrative context around analytical results rather than relying only on a chart sent without explanation.
- Trade-off: narrative and alerting features still need dependable metric definitions, data access rules, and an owner who reviews what gets distributed.
Enterprise BI pricing is quoted using named users, server CPU cores, or user tiers. The vendor also distinguishes self-managed and fully managed service options. Ask which monitoring features, hosting, support, and evaluation terms are included in your quote.
10. Dundas BI: custom embedded analytics
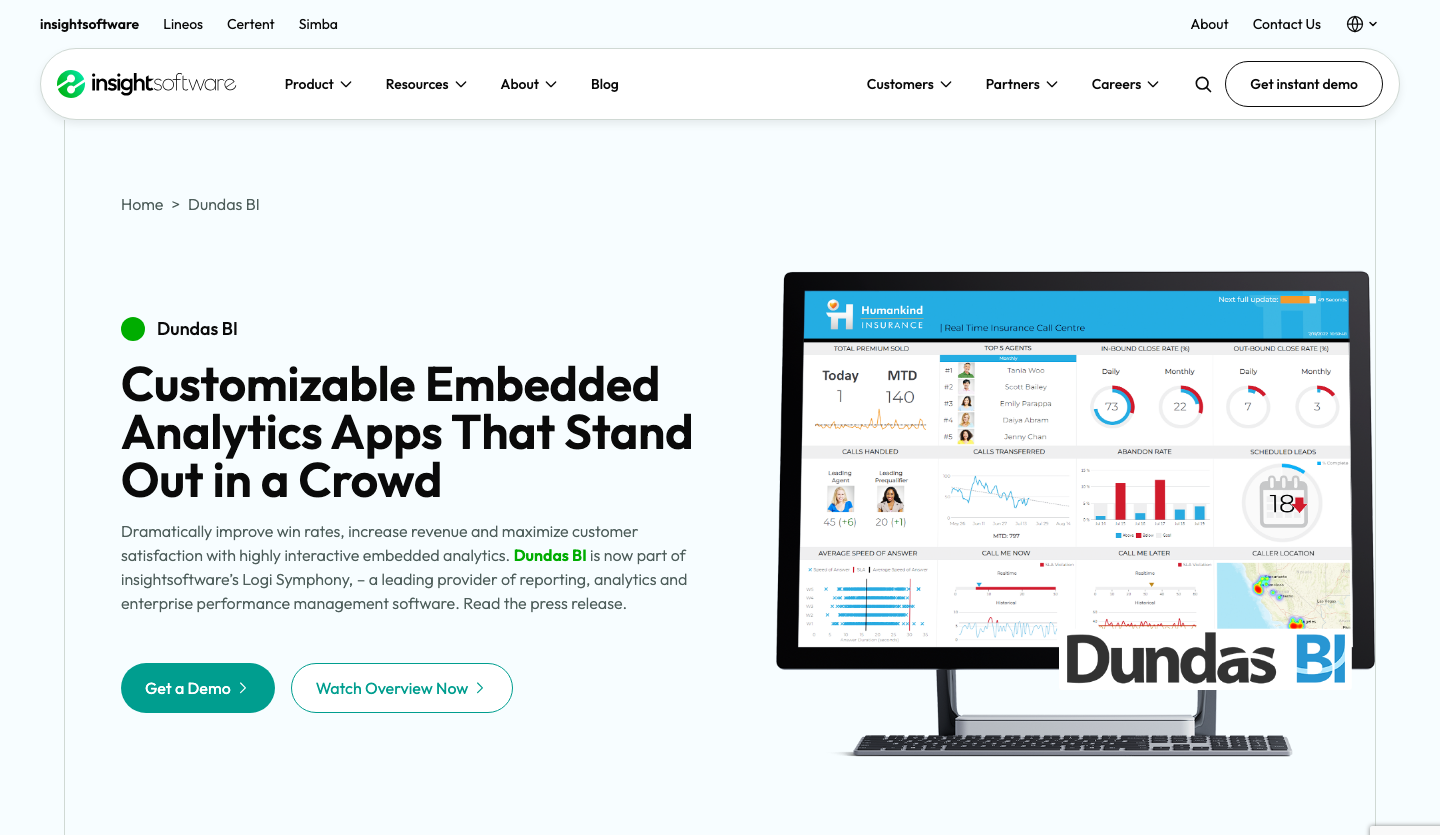
Dundas BI is presented by insightsoftware as part of Logi Symphony. Its current product page focuses on custom, white-label analytics that fit an existing application’s experience.
- Strength: its programmable approach suits teams that need to control dashboard design, interactions, and the way analytics appears inside their own software.
- Trade-off: that flexibility requires implementation and ongoing ownership. Confirm the product edition, integration path, deployment model, and support obligations for the contract you are actually buying.
The old Dundas pricing URL now redirects to the current product page , which requests a sales conversation. Treat new deployments as quote-based. An old promotional capacity price found in indexed material is not a confirmed current offer.
Compare prices and licensing
These are published entry points or quote requirements, not like-for-like total costs. Annual-billing figures below are monthly equivalents, not monthly cancellation options. Where tax treatment is not explicitly stated, confirm it in the vendor’s quote or checkout. Warehouse queries, storage, hosting, connectors, implementation, and support can add to the bill.
| Service | Published price | License and contract conditions |
|---|---|---|
| 1. Microsoft Power BI | Pro: $14/user/month PPU: $24/user/month | Paid yearly. Free authoring is separate from private sharing; check E5 entitlements. Official pricing information |
| 2. Tableau Cloud | Standard: $75 Creator / $42 Explorer / $15 Viewer Per user/month, billed annually | At least one Creator. Enterprise and AI editions differ; no monthly Cloud plan. Official pricing information |
| 3. Microsoft Fabric | Regional capacity pricing | Pay-as-you-go or reservation; add storage and applicable Power BI licenses. 60-day trial has exclusions. Official pricing information |
| 4. Qlik Cloud Analytics | Starter: from $300/month Standard: from $825/month | Billed annually. Starter: 10 users / fixed 10 GB. Standard: 25 GB, no additional user charge. Official pricing information |
| 5. Looker | Platform + user licenses: quote | Annual commitment. Includes 10 Standard and 2 Developer users; warehouse costs separate. Official pricing information |
| 6. IBM Cognos Analytics | Standard: from $11.25 Premium: from $44.90 Per authorized user/month | Indicative US display, tax/duty excluded. Confirm term and annual offer. On-demand trial offered. Official pricing information |
| 7. Sisense | Self-serve / Enterprise: confirm price | Public plans page gives no numeric rate. Confirm usage, embedding, deployment, and trial terms. Official pricing information |
| 8. Spotfire Analytics | Current quote required | Confirm edition, roles, deployment, and evaluation access; no verified current public rate. Official pricing information |
| 9. Yellowfin | Enterprise BI: quote | Named user, server-core, or user-tier licensing; confirm hosting and included features. Official pricing information |
| 10. Dundas BI | Current quote required | Confirm Logi Symphony product scope, capacity/users, embedding, support, and evaluation terms. Official pricing information |
An illustrative seat budget: two authors and eighteen read-only colleagues would cost $280/month equivalent ($3,360/year) if all twenty use standalone Power BI Pro at its listed annual rate. Two Tableau Cloud Standard Creators plus eighteen Viewers would cost $420/month equivalent ($5,040/year). These calculations exclude tax, infrastructure, discounts, existing licenses, and capacity alternatives. They compare that specific seat mix, not overall product value or performance.
Build a useful shortlist
Start with two or three candidates that fit the work:
- Recurring internal reports: evaluate Power BI or Tableau against the team’s existing skills and reader licenses.
- Shared metrics on a warehouse: examine Looker’s modeling workflow and who will maintain it.
- A wider Microsoft data project: evaluate Fabric together with Power BI, including capacity costs.
- Exploration across related data: try Qlik’s associative selections on a real business question.
- Scheduled, structured reporting: test Cognos with the actual report and distribution rules.
- Analytics embedded in a product: compare Sisense and Dundas using the same customer permissions and integration requirements.
- Industrial investigations: test Spotfire with representative operational data and a domain expert.
- Explaining findings to business teams: assess Yellowfin’s storytelling and monitoring workflow.
Avoid buying the platform solely because its demonstration dashboard looks polished. A small working report with your data reveals more about the implementation effort.
Check a dashboard before buying
Use a non-sensitive sample that resembles the real workload. Agree on acceptance criteria before the demo, and record the result rather than assuming a feature name proves it works.
- Reconcile one metric. For net revenue, specify refunds, canceled orders, currency conversion, and the reporting date. Compare the dashboard total with an independently checked source extract.
- Measure freshness. Add a test record and note when it appears. Include connector, warehouse, and report-refresh delays.
- Test the reader’s account. Verify that a regional manager cannot see another region’s records through a chart, drill-down, export, or shared link.
- Try a realistic workload. Use representative data volume, filters, and simultaneous readers. Record loading time and query or capacity usage.
- Practice maintenance. Change a source column, simulate an expired credential, and check who receives the failure notification.
- Price the second year. Include expected user growth, data growth, support, implementation, renewal conditions, and the cost of exporting or migrating away.
If an AI assistant answers questions about the data, review the selected metric, filters, date range, and underlying query. A fluent answer is not evidence that the intended business definition was used.
Discuss the results across languages
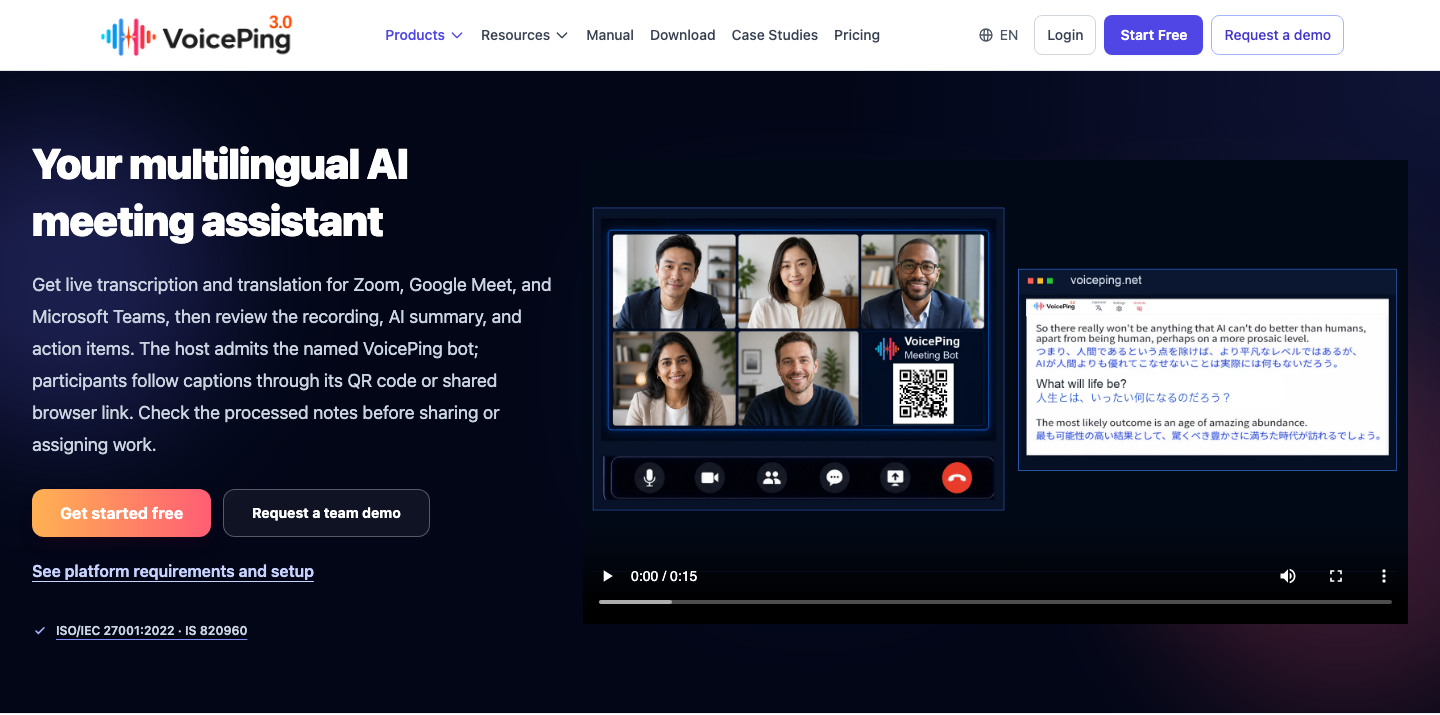
VoicePing Meeting Bot complements the meeting around a dashboard. It provides live transcription and translation for supported Zoom, Google Meet, and Microsoft Teams meetings, followed by a recording, summary, and action items.
The host admits the named bot, and participants can follow captions through its QR code or shared browser link. Review translated numbers, product names, and the final notes before assigning work. Access to the meeting recording and access to the BI dashboard should each follow the team’s permissions policy.
VoicePing is not one of the ten BI platforms in this comparison. It does not replace warehouse queries, metric modeling, dashboard permissions, or BI software licenses.