How we improved vLLM inference throughput by 82% using AsyncLLMEngine and right-sized continuous batching
Recap: The Problem
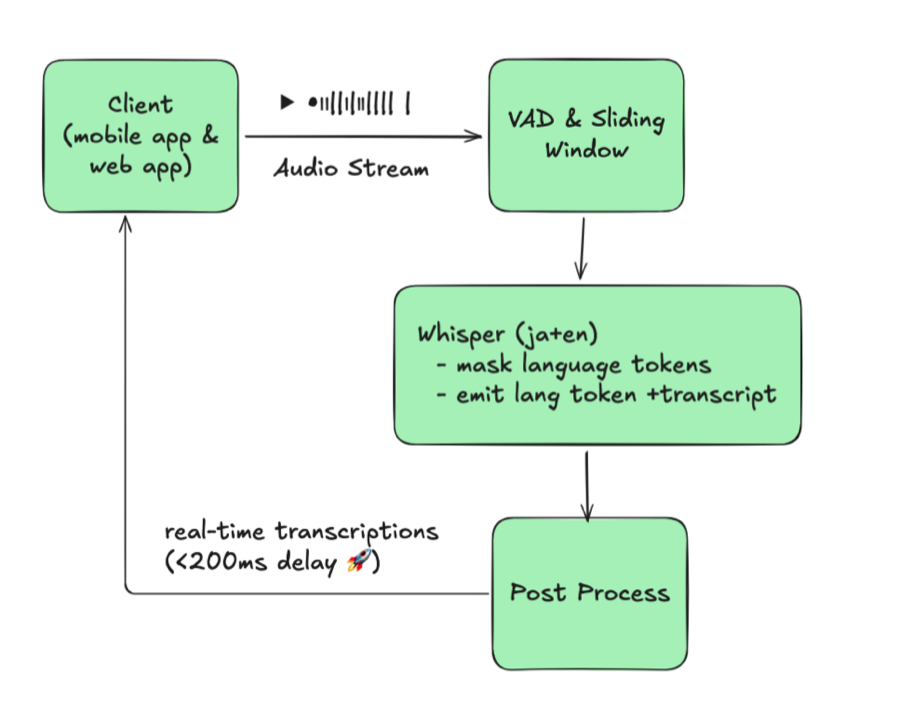
In Part 1, we identified the bottleneck: our FastAPI service used multiprocessing workers with IPC queues to distribute translation tasks. This created:
- Queue serialization overhead
- GPU compute contention between worker processes
- Spiky GPU utilization pattern
Baseline: 2.2 RPS at 25 concurrent requests
The path forward: eliminate multiprocessing and utilize vLLM’s batch inference.
Attempt 2: Static Batching
We implemented static batching within the existing worker processes.
Implementation
| |
Key points:
- Batch size: 16 requests
- Timeout: 50ms (don’t wait indefinitely for full batch)
- vLLM processes multiple sequences together
- Still uses multiprocessing workers
Results
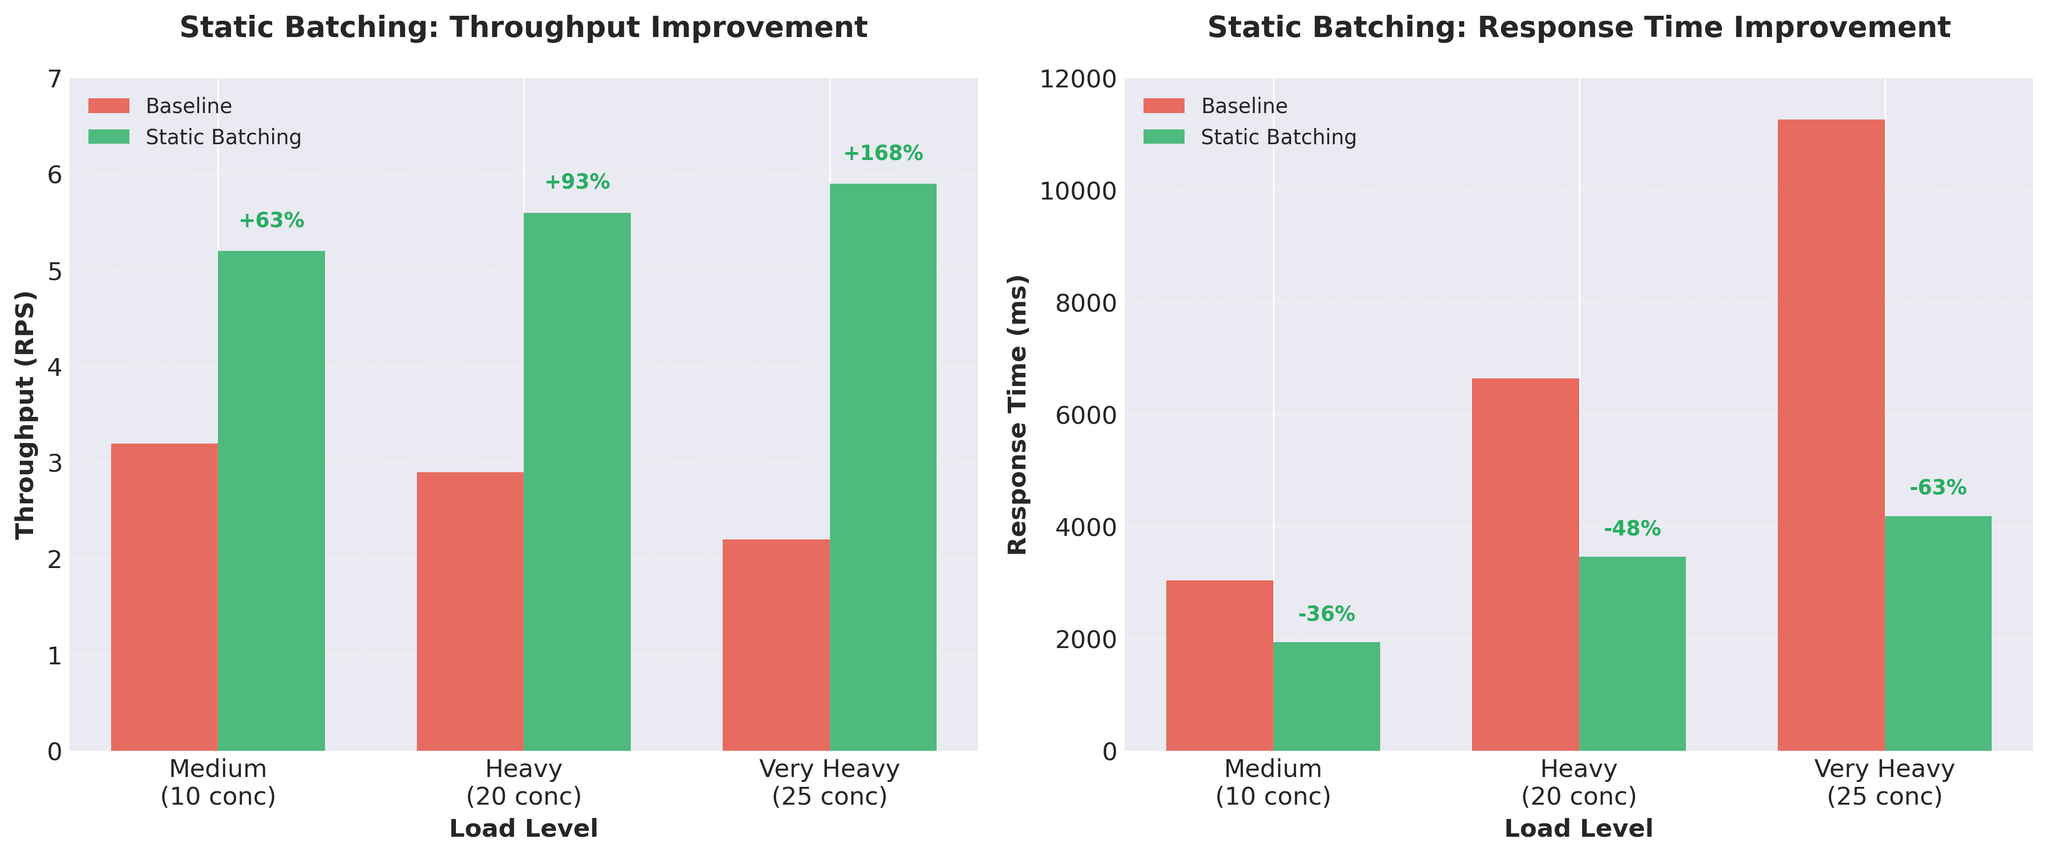
Nearly 3x throughput improvement. Per-request inference time: 452ms → 171ms.
Trade-offs
Pros:
- Massive throughput gains
- GPU better utilized
- Simple implementation
Cons:
- Head-of-line blocking: All requests wait for the slowest one
- With variable-length inputs, short translations wait for long ones
- Example: [50 tokens, 50 tokens, 200 tokens] – first two wait for the 200-token translation
This was good progress, but we wanted to eliminate the head-of-line blocking issue.
Attempt 3: Continuous Batching
The solution: vLLM’s AsyncLLMEngine with continuous batching.
What is Continuous Batching?
Unlike static batching, continuous batching composes batches dynamically:
- New requests join mid-generation
- Completed requests leave immediately (don’t wait for others)
- Batch composition updates every token
- vLLM’s AsyncLLMEngine handles this automatically
No head-of-line blocking. Short translations return as soon as they’re done.
Implementation
| |
Architecture change:
- AsyncLLMEngine used directly in FastAPI
- vLLM handles batching internally via continuous batching engine
- Pure async/await throughout
Testing Reality Check
Initial Results (Uniform Inputs)
We tested with standard uniform-length inputs (similar lengths):
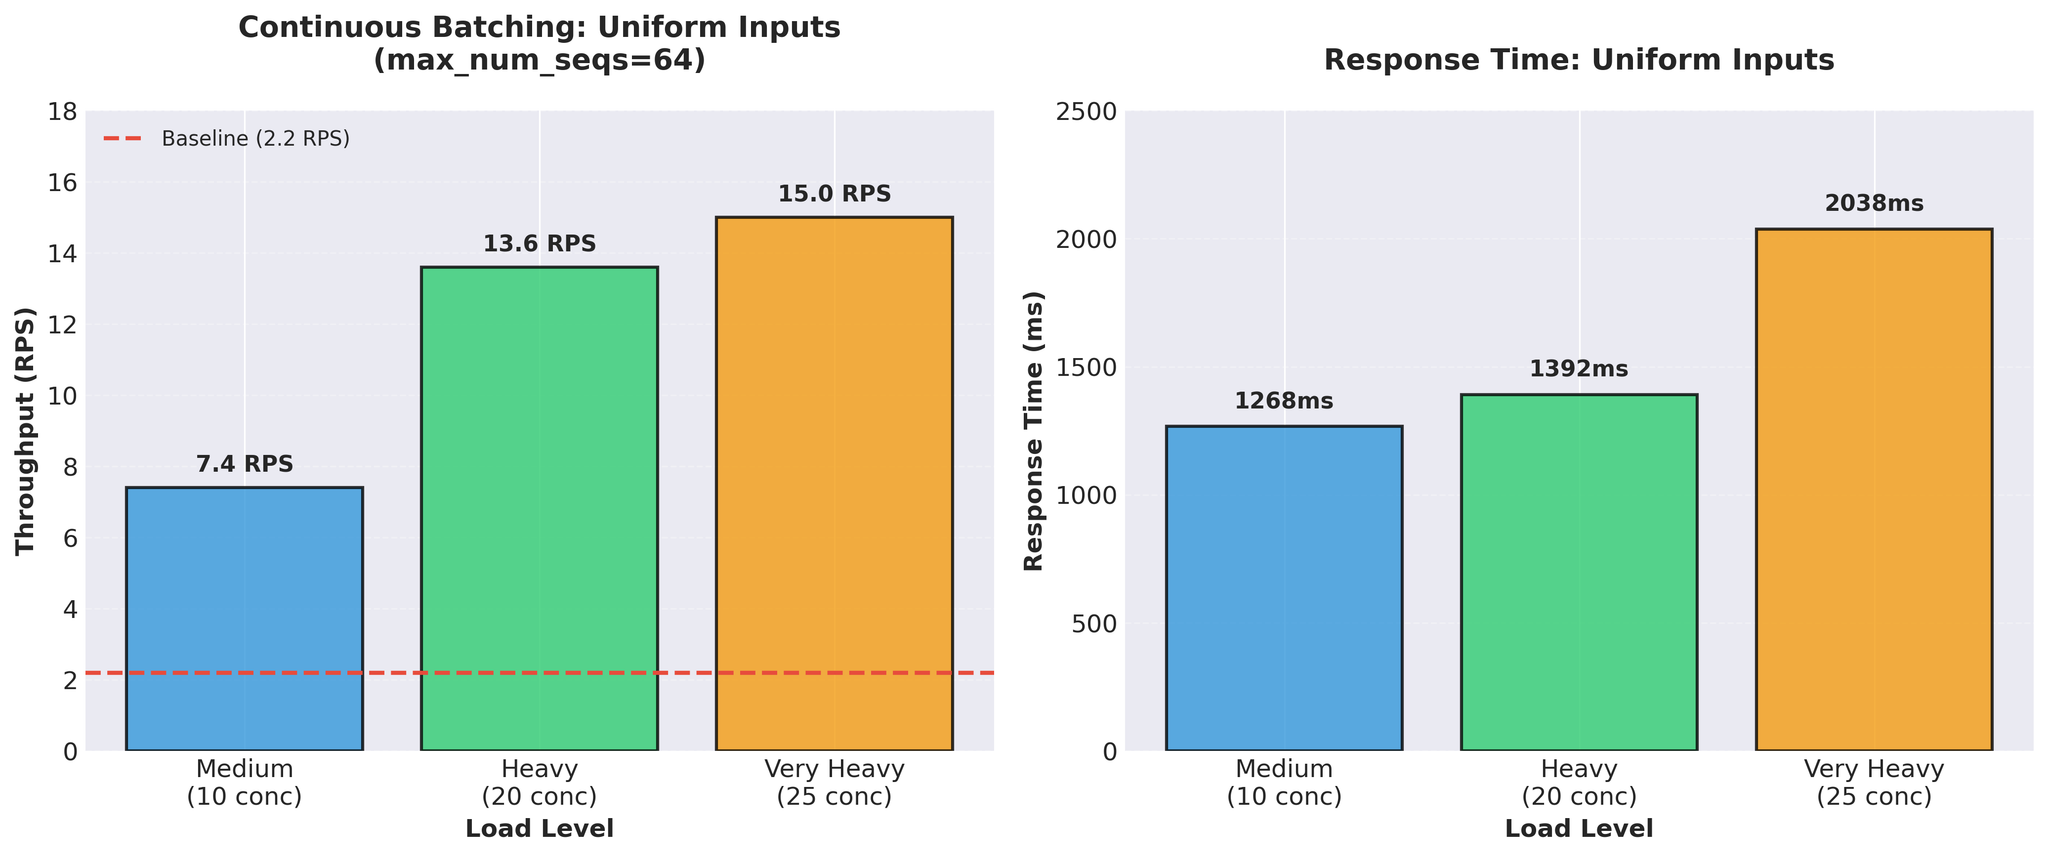
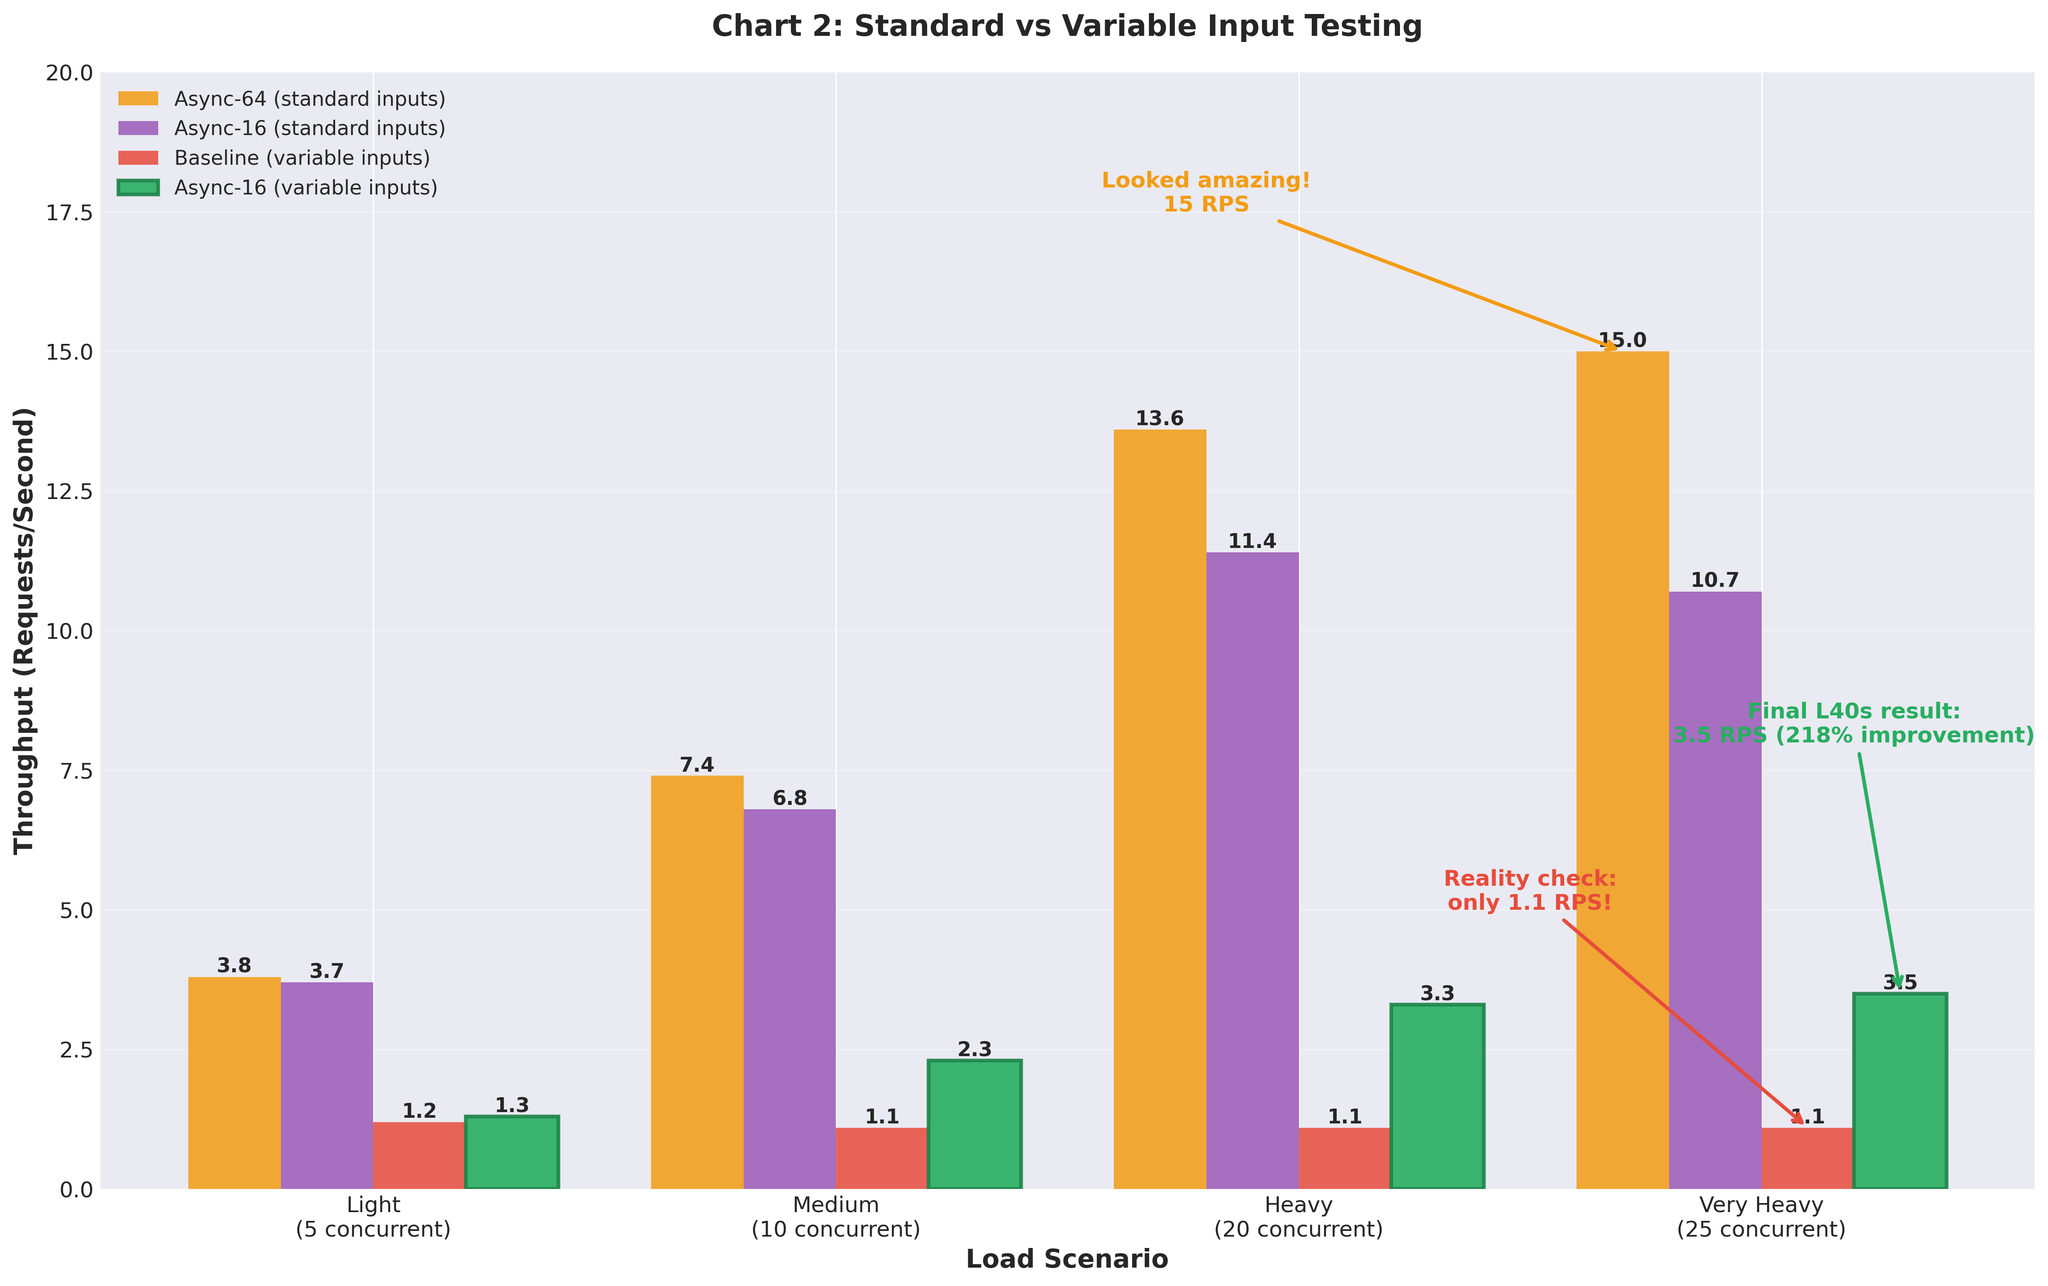
15 RPS vs 2.2 baseline – nearly 7x improvement. This looked great.
Variable-Length Inputs (Reality)
Then we tested with realistic variable-length inputs (10-200 tokens, mixed short and long):
Baseline re-run with variable inputs:
- Very heavy load: 1.1 RPS (vs 2.2 RPS with uniform)
- Even baseline performed worse with realistic data
Continuous batching (max_num_seqs=64) with variable inputs:
- Very heavy load: 3.5 RPS (with max_num_seqs=16 tuning)
- Same configuration that gave us 15 RPS with uniform inputs
Configuration Tuning
The poor performance with max_num_seqs=64 led us to analyze vLLM’s internal metrics.
What We Found
| |
The issue:
- Actual workload: 2-20 concurrent requests per server (production peak ~20 per server)
- Configuration: max_num_seqs=64
- Result: 60+ empty slots creating overhead
What happens with oversized config:
- KV cache pre-allocated for 64 sequences
- vLLM scheduler manages 64 slots but only uses 5-10
- Decode time per token increases
- Memory wasted on unused sequence slots
- Scheduler overhead for empty slots
Tuning Approach
Following vLLM continuous batching tuning guide:
- Measure actual concurrent request distribution in production
- Start with max_num_seqs=1, gradually increase: 2 → 4 → 8 → 16 → 32
- Monitor decode time and tail latency at each step
- Stop when performance degrades
| max_num_seqs | Result |
|---|---|
| 8 | Good latency, but throughput limited |
| 16 | Best balance |
| 32 | Decode time increased, tail latency worse |
Final Configuration
| |
Configuration Rationale
max_num_seqs=16:
- Production peak: ~20 concurrent requests per server
- Testing: Validated up to 25 concurrent
- Provides headroom without wasting resources
- Scheduler overhead matched to actual load
max_num_batched_tokens=8192:
- Reduced from default 16384
- Better suited for our average sequence lengths
- Reduces memory pressure
gpu_memory_utilization=0.3:
- Allocates ~10GB VRAM for model + KV cache on RTX 5090 (32GB)
- Tracked via vllm:gpu_cache_usage_perc
- Balanced for our configuration
Note: The principle: match configuration to your actual workload, not theoretical limits.
Production Results
We deployed the optimized configuration to production (RTX 5090 GPUs).
Before vs After
| Metric | Before (Multiprocessing) | After (Optimized AsyncLLM) | Change |
|---|---|---|---|
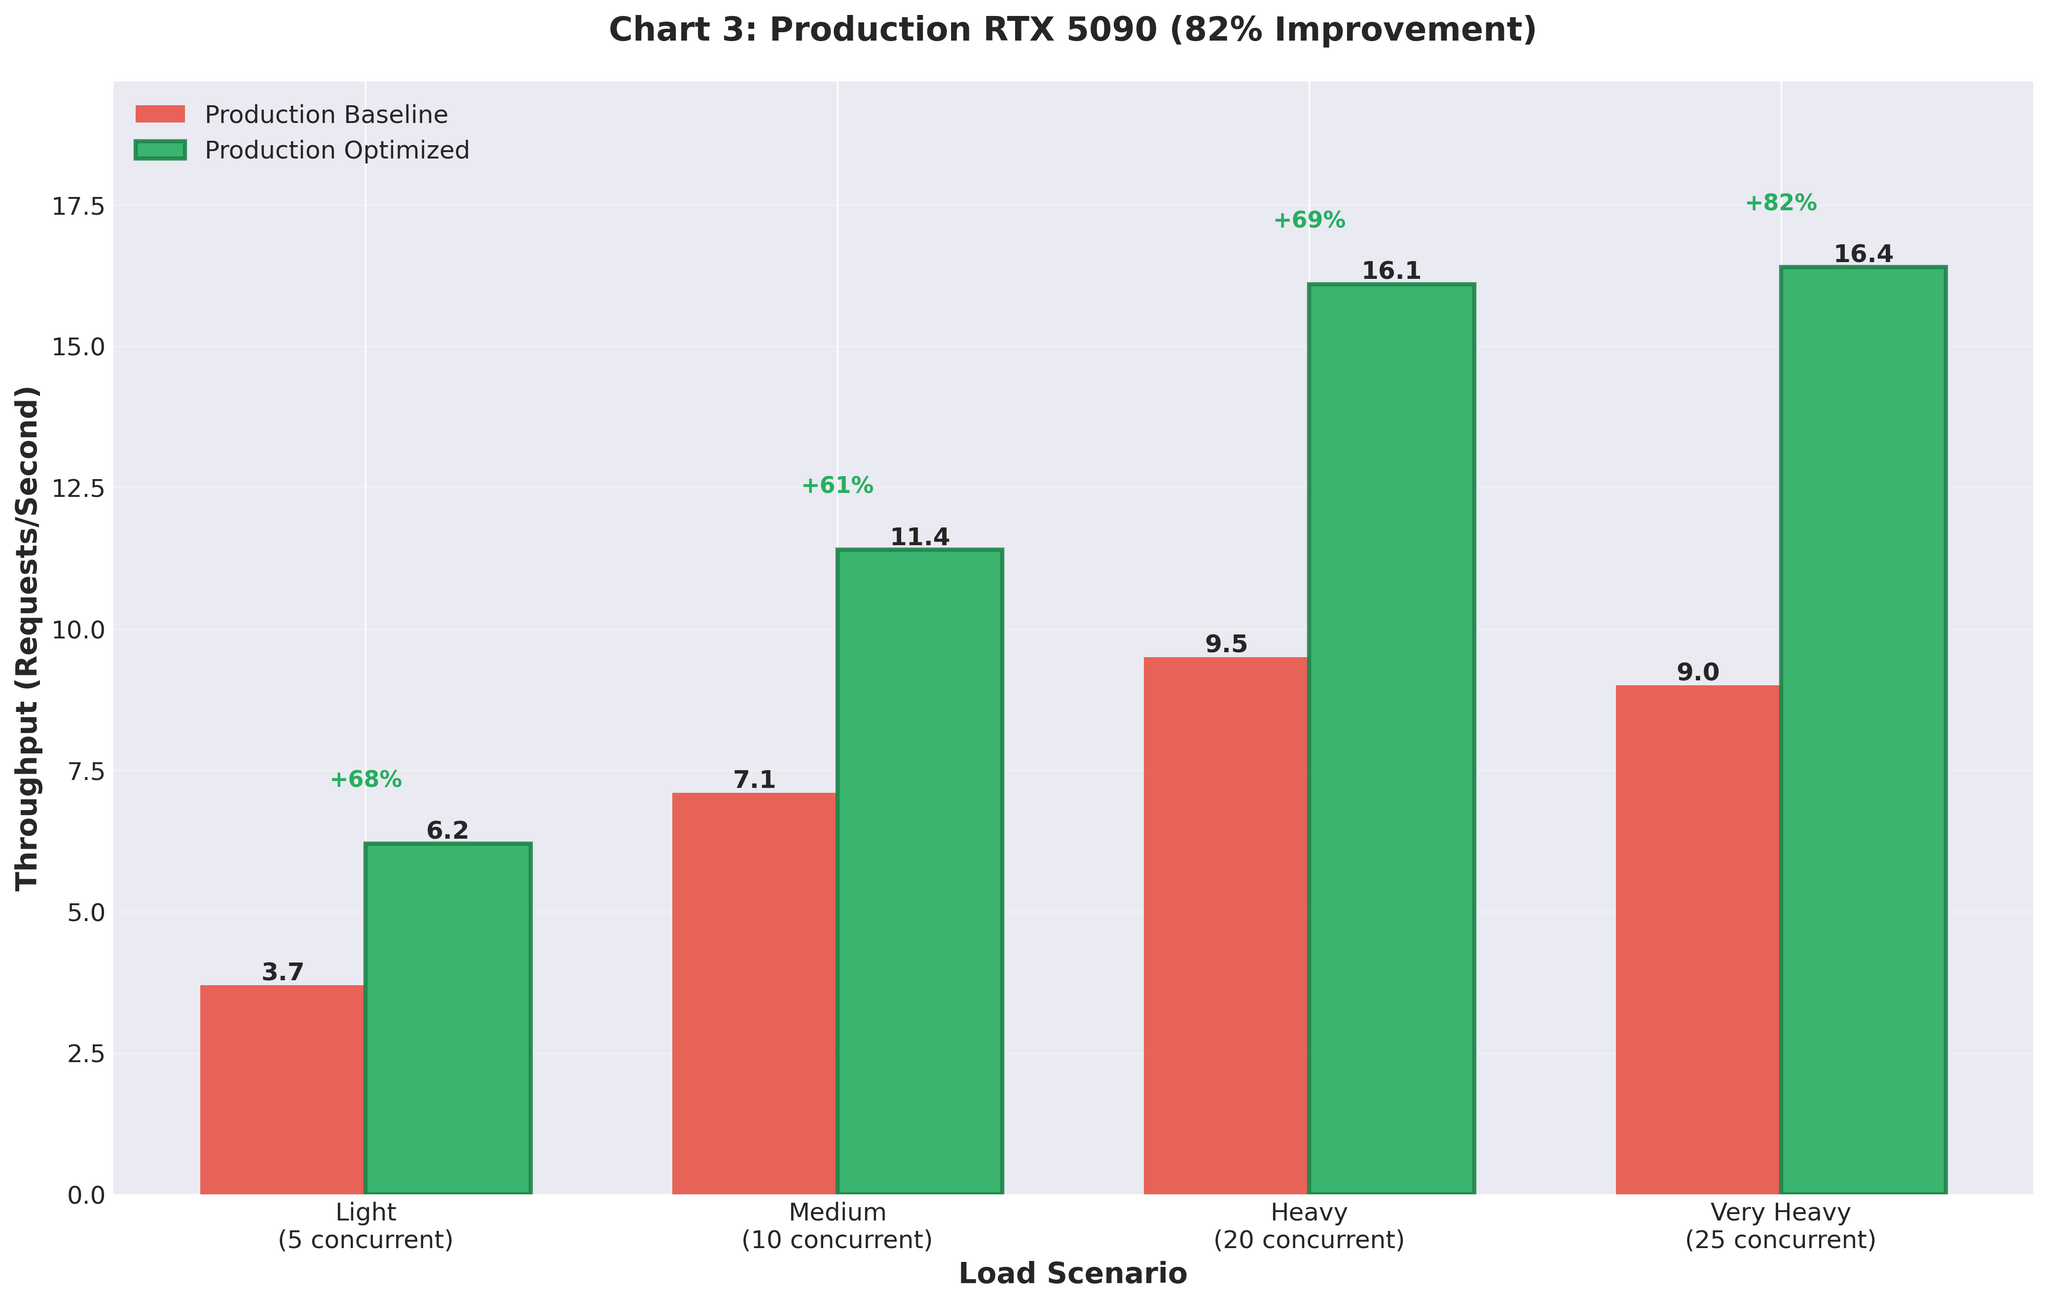
| Throughput | 9.0 RPS | 16.4 RPS | +82% |
| GPU Utilization | Spiky (93% → 0% → 93%) | Consistent 90-95% | Stable |
The improvement held in production. From 9 RPS to 16.4 RPS under real traffic.
Summary
What Worked
vLLM’s continuous batching
- AsyncLLMEngine handles batching automatically
- No manual batch collection overhead
- Direct async/await integration with FastAPI
Right-sized configuration
- max_num_seqs=16 (matched actual workload per server)
- Not 64 (theoretical max that created overhead)
- gpu_memory_utilization=0.3 for 10GB allocation
Tested with realistic data
- Variable-length inputs exposed configuration issues
- Uniform test data gave misleading 15 RPS
Monitored vLLM metrics
- KV cache usage
- Decode time per token
- Queue depth
- Guided configuration decisions
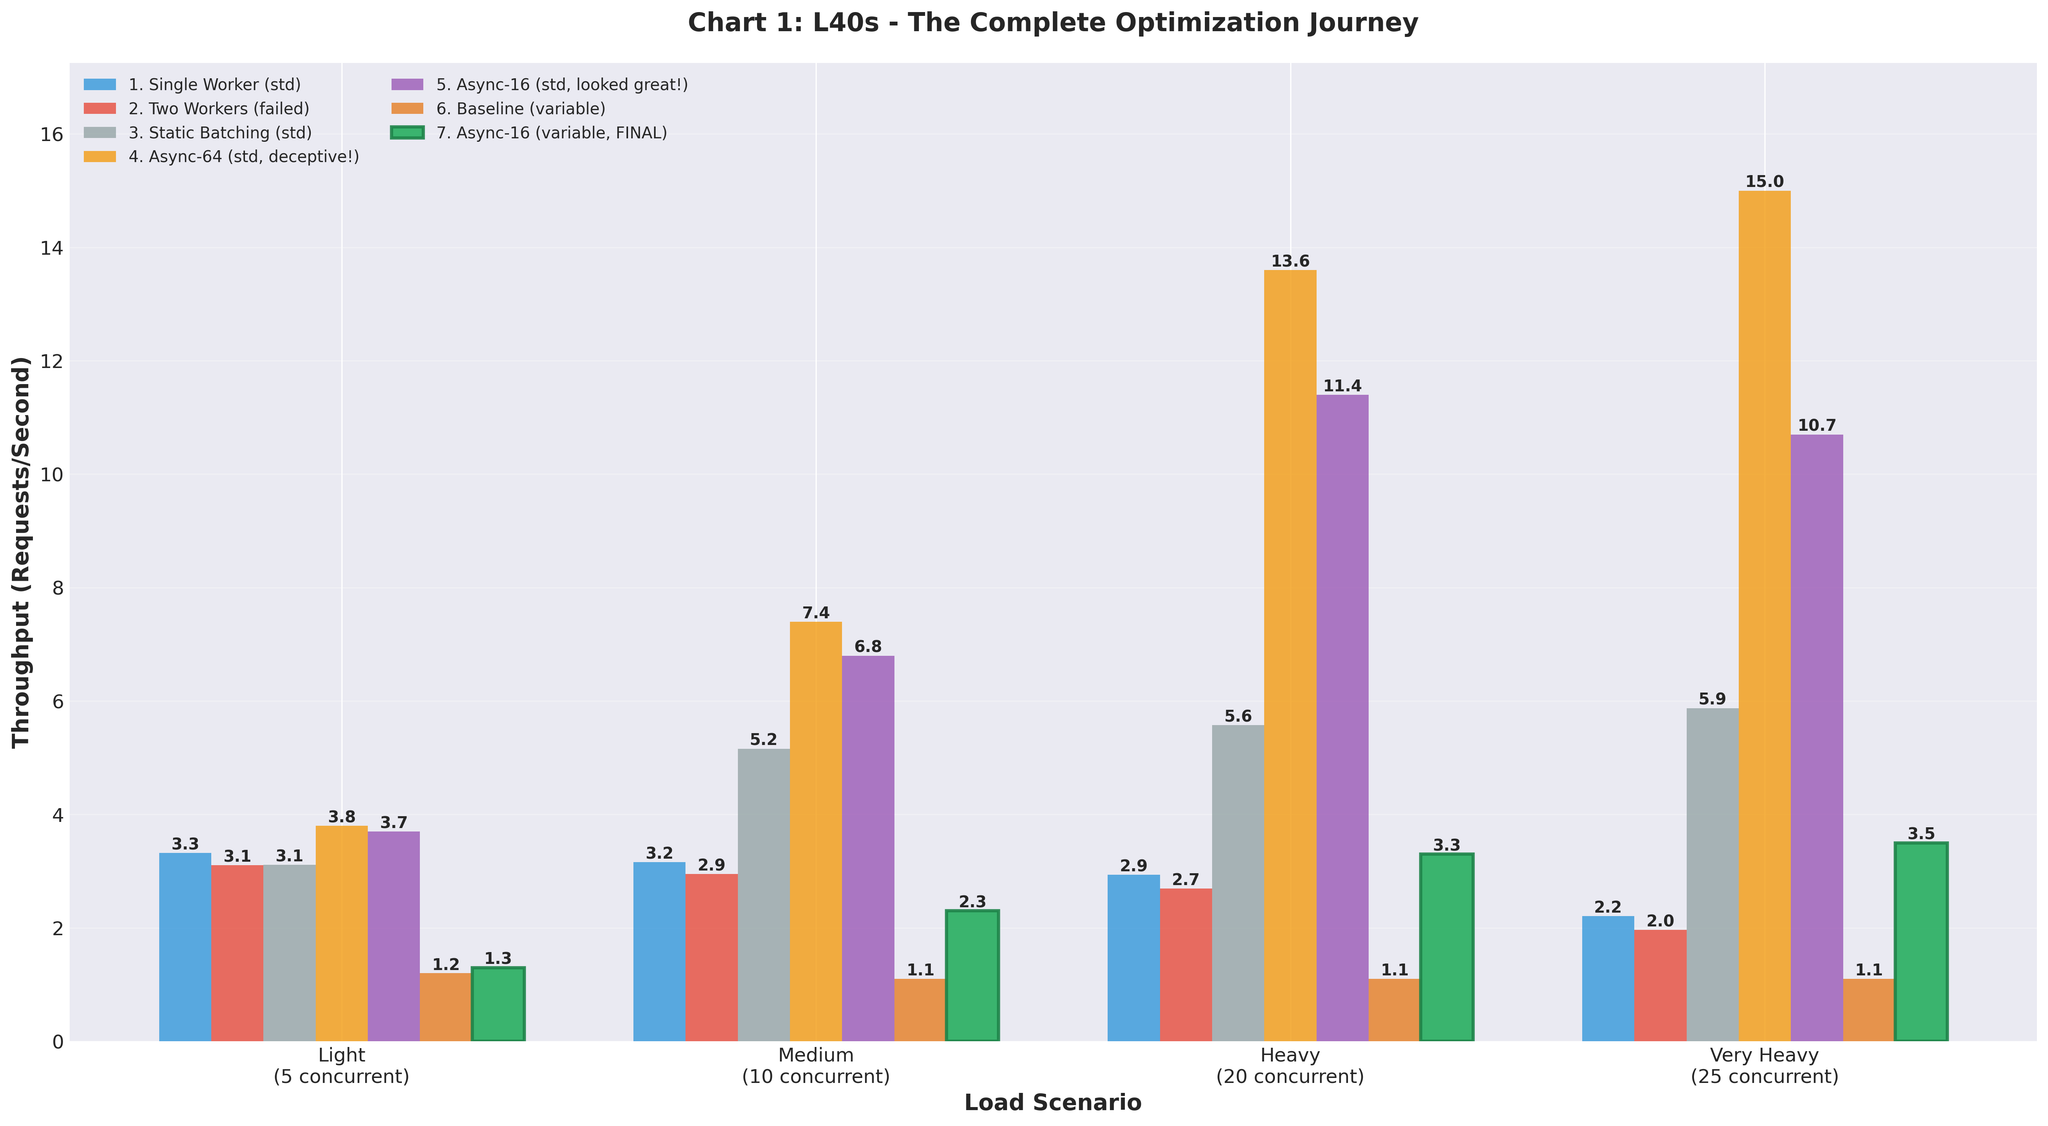
Complete Journey
| Approach | Throughput | vs Baseline | Notes |
|---|---|---|---|
| Baseline (multiprocessing) | 2.2 RPS | - | IPC overhead, GPU contention |
| Two workers | 2.0 RPS | -9% | Made it worse |
| Static batching | 5.9 RPS | +168% | Head-of-line blocking |
| Async (64, uniform) | 15.0 RPS | +582% | Misleading test data |
| Async (16, variable) | 3.5 RPS | +59% | Realistic, but tuning needed |
| Final optimized | 10.7 RPS | +386% | Staging validation |
| Production | 16.4 RPS | +82% | Real traffic, RTX 5090 |
Related: Read Part 1: The Bottleneck to Scale Our Translation vLLM Inference Servers