Identifying architectural bottlenecks in FastAPI + multiprocessing setup preventing efficient GPU utilization
The Problem
We run a translation microservice using FastAPI and vLLM. Under heavy load, we hit server latency issues that didn’t match what our GPU utilization metrics suggested.
GPU utilization showed a stuttering pattern: spike to 93%, drop to 0%, spike again. Not the consistent high utilization we expected.
The question: if the GPU has idle periods, where’s the bottleneck?
This article covers how we identified the architectural issues in our FastAPI + multiprocessing setup that were preventing efficient GPU utilization.
System Context
Our translation service runs as multiple API servers behind a load balancer:
- Clients: Web, mobile, backend services
- Proxy: Routes requests based on language pairs and server health
- API Servers: Multiple FastAPI instances, each running vLLM
This article focuses on a single API server’s internal architecture and bottlenecks.
API Server Architecture
Here’s the internal structure of one API server:

Components
1. FastAPI Main Process
| |
- Handles HTTP requests with async/await
- Single Python process, one event loop
- Non-blocking I/O for concurrent request handling
2. TranslationService
| |
- Creates translation tasks
- Manages EventTask objects with asyncio.Event
- Bridges async/await with multiprocessing
3. TranslationWorker (Main Process)
| |
- Queues created in main process (shared with workers)
- JoinableQueue for task distribution
- manager().dict() for shared task state
- Event queue for results
4. Worker Processes
| |
- Spawned as separate processes (ctx.Process)
- Each loads its own vLLM model instance
- Pull from shared translation_queue
- Return via shared event_queue
5. EventTask (Async Synchronization)
| |
- Bridges multiprocessing with async/await
- Each request gets an EventTask
await event.wait()blocks coroutine until worker completes
Request Flow
Here’s what happens for a single translation request:

Step by step:
- Client POST /translate → FastAPI creates async coroutine
- async translate() → TranslationService handles request
- create_task() → Generate ID, create TranslationTask in shared dict
- queue.put(key) → Serialize task key, send to workers (IPC overhead)
- Worker: vllm.translate() → Worker processes translation
- event_queue.put(result) → Serialize result, send back (IPC overhead)
- event.set() → Update EventTask, wake coroutine
- await event.wait() unblocked → Retrieve result
- Return response → Send to client
Overhead points:
- Step 4: Serialization (pickle task key)
- Step 6: Serialization (pickle result)
- Step 8: Async waiting for multiprocessing result
- IPC coordination throughout
Baseline Performance
Before optimization attempts:
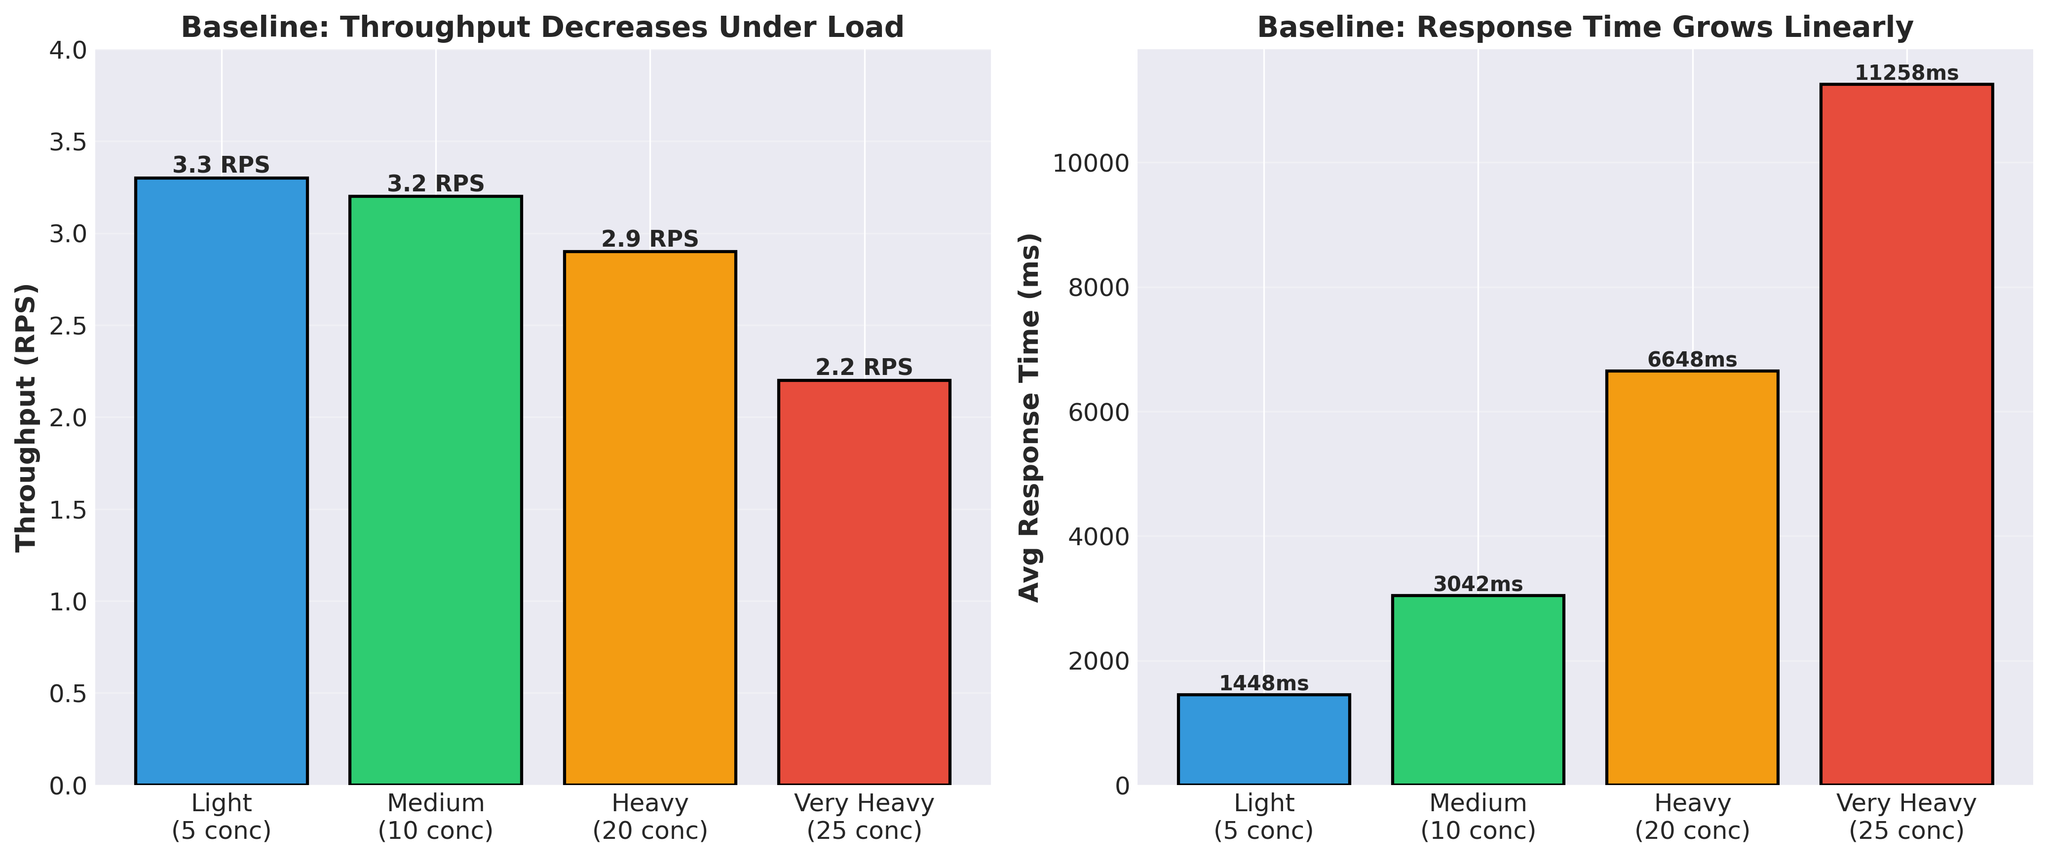
Pattern:
- Response time grows linearly (1.4s → 11.3s)
- Throughput decreases under load (3.3 → 2.2 RPS)
- Actual vLLM translation time per request: 300-450ms
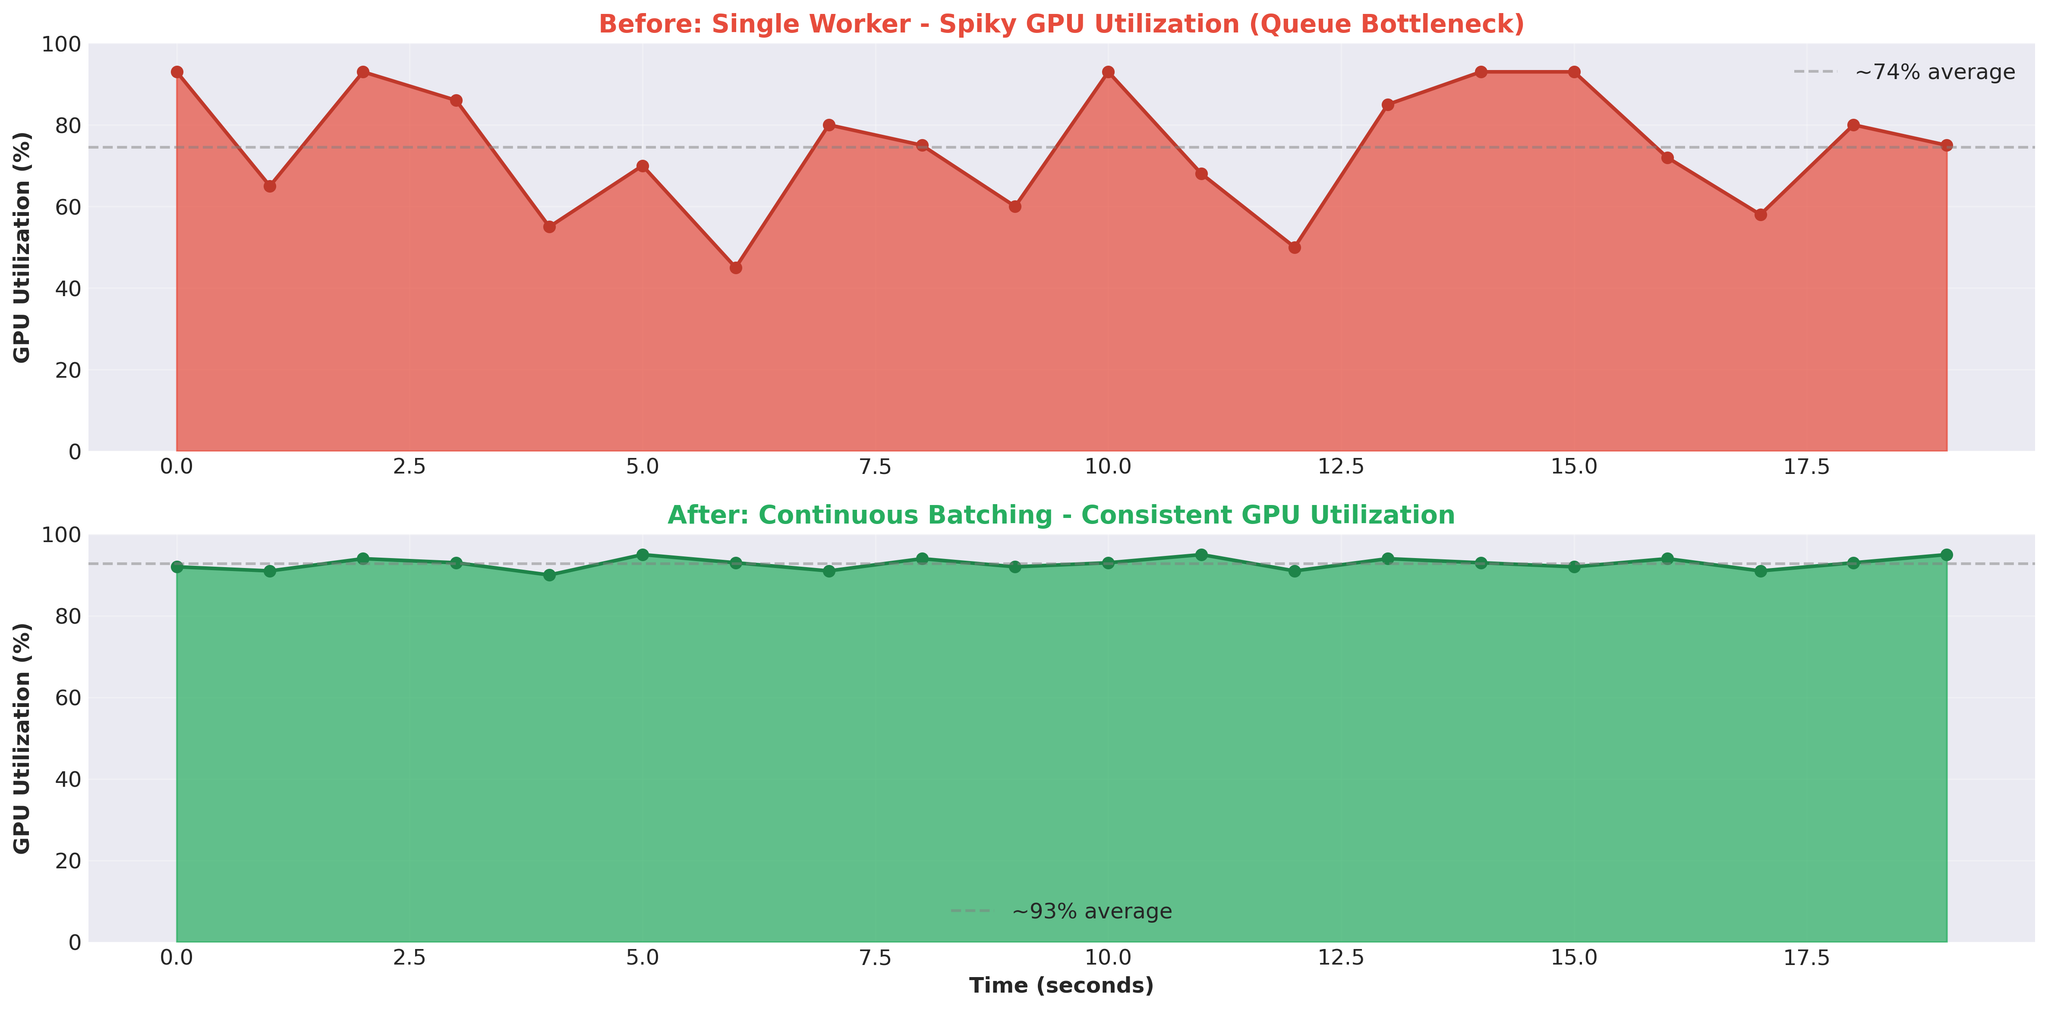
Spiky pattern: GPU alternates between busy and idle. This indicated the GPU was waiting for work, not compute-bound.
Attempt 1: Multiple Workers
First hypothesis: more workers = better parallelization.
We increased from 1 worker to 2 workers.
Configuration
| |
- Worker 1: Models A+B
- Worker 2: Model C
- Both share the same GPU
Results
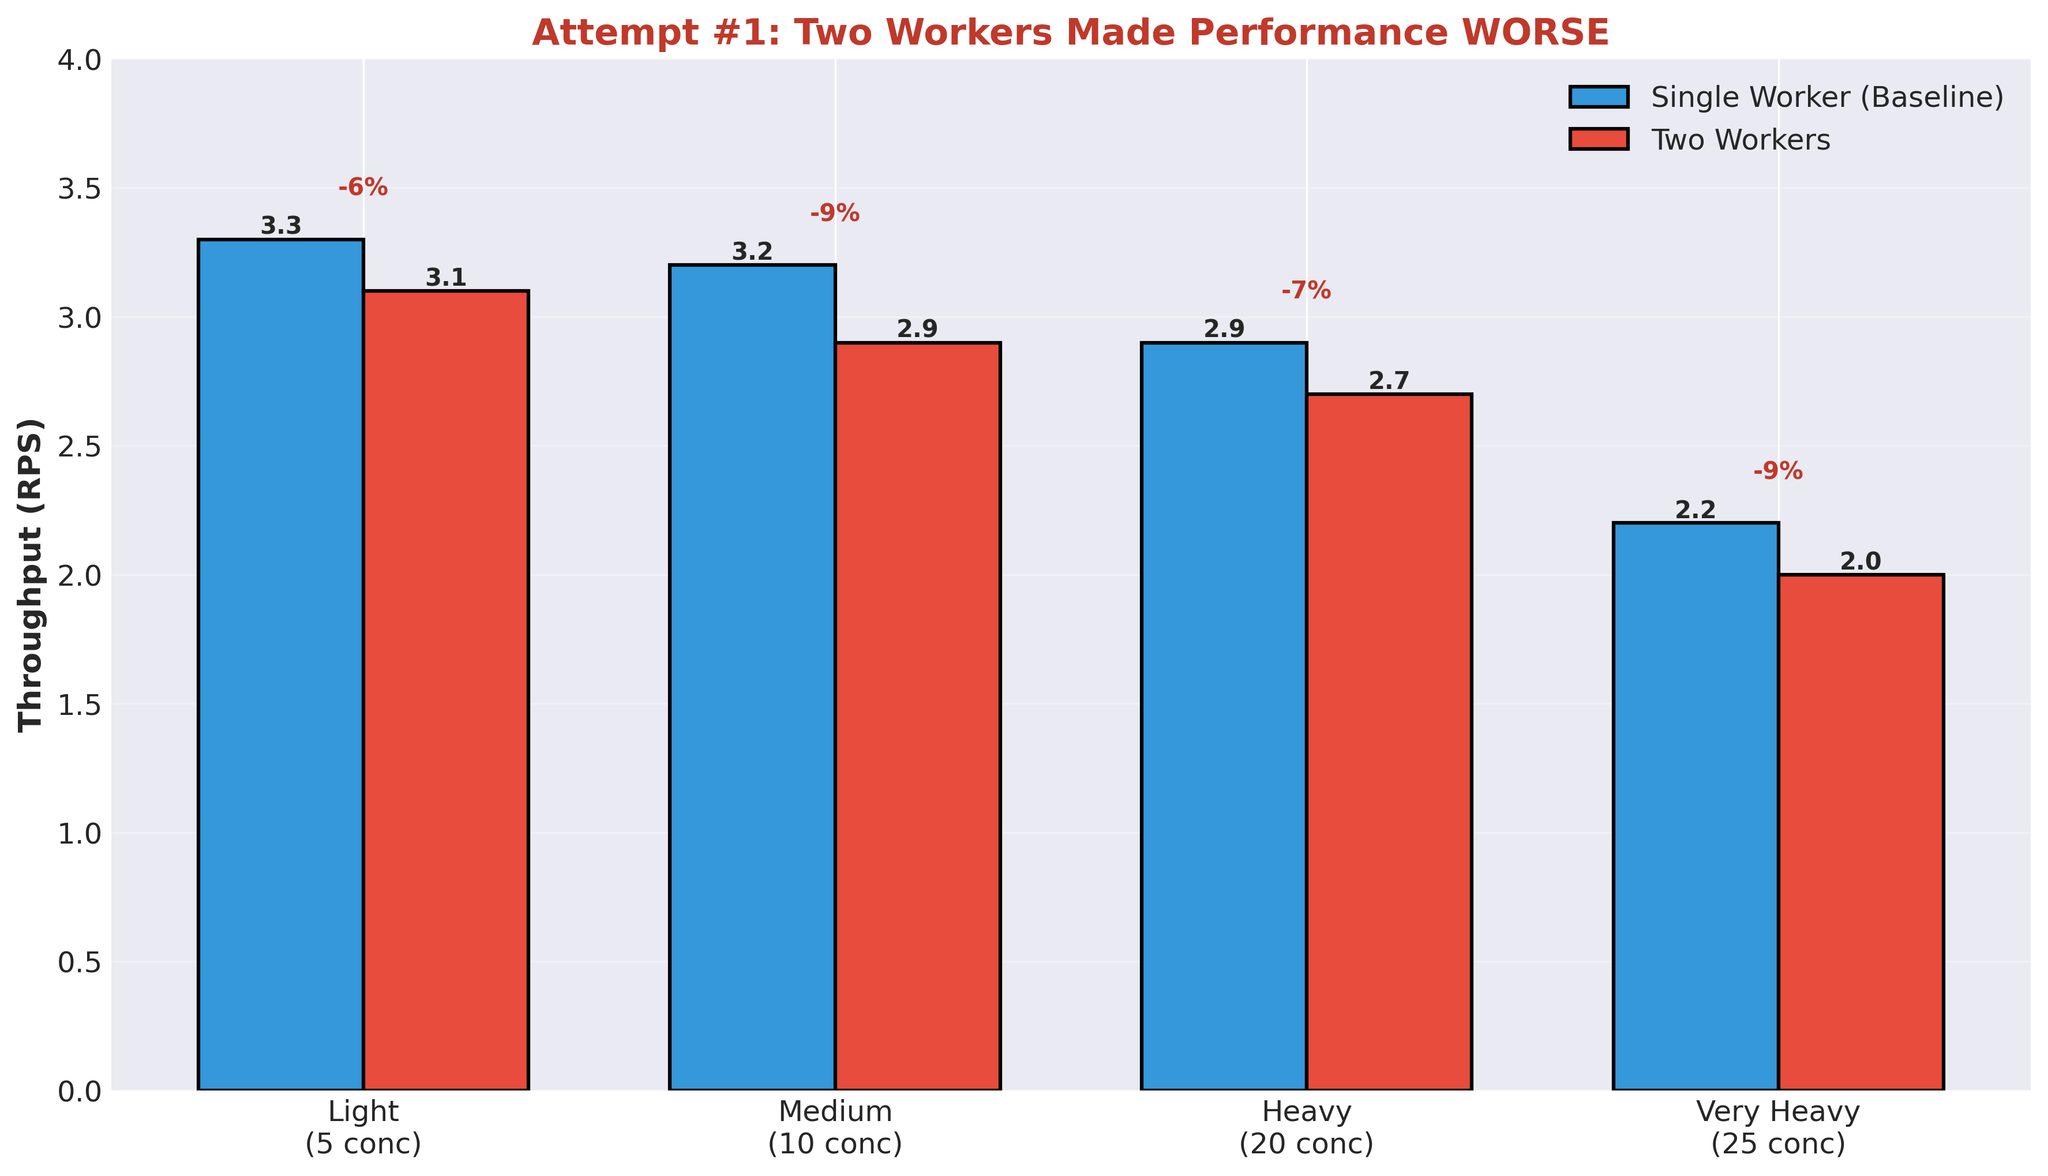
Median translation time also degraded: 452ms → 2,239ms.
Performance dropped across all load levels.
Why Multiple Workers Failed
This result makes sense when you understand GPU behavior and our architecture.

The Issue: Compute Contention
When one worker is processing a translation:
- It uses ~90% of GPU compute capacity
- Other workers can’t effectively utilize the remaining capacity in parallel
- Workers end up waiting for GPU availability
Why no parallel benefit:
- Worker 1 starts vLLM generation → uses ~90% GPU compute
- Worker 2 tries to start → only ~10% GPU compute available
- Worker 2 runs slowly or waits
- Effectively sequential execution despite separate processes
Additional overhead:
- Process spawning and management
- GPU memory split between workers (each loads model weights)
- IPC queue coordination
- Context switching between processes
The GPU can technically run multiple CUDA kernels simultaneously, but when one worker is actively using ~90% of compute capacity, there’s insufficient remaining capacity for another worker to run efficiently in parallel.
Additional Architectural Issues
With multiple workers competing for the same resources:
- Context switching overhead: OS switching between worker processes
- Doubled memory usage: Each worker loads full model weights
- No effective parallelism: Sequential GPU execution despite parallel architecture
The same queues handle all workers (translation_queue and event_queue shared), so the IPC overhead per request remains constant. However, the additional overhead from process management, context switching, and memory duplication, combined with no parallel GPU benefit, made performance worse.
Identified Bottlenecks
After this experiment, we identified the core issues:
1. IPC Serialization Overhead
- Every request: serialize task → worker, serialize result → main
- Python multiprocessing queue uses pickle
- Overhead on every request
2. Compute Contention
- One worker using ~90% GPU compute
- Other workers can’t run effectively in parallel
- Sequential execution despite multiprocessing
3. Async/Await + Multiprocessing Bridge
- asyncio.Event waiting for multiprocessing result
- Thread-based event queue consumer
- Coordination overhead between async and multiprocess models
4. Wasted GPU Cycles
- GPU idle while waiting for queue operations
- Spiky utilization (93% → 0% → 93%)
- Translation time ~400ms, total response time 11+ seconds
- Most time spent in queues, not computing
5. Architecture Complexity
- FastAPI (async/await)
- TranslationService (bridge)
- TranslationWorker (coordination)
- JoinableQueue (IPC)
- Worker processes (multiprocessing)
- Event queue (IPC)
- EventTask (async sync)
- vLLM (actual work)
Each layer added latency.
Key Insights
1. Async/Await + Multiprocessing = Overhead
Bridging these two concurrency models requires coordination:
- asyncio.Event for async waiting
- Thread pool for consuming event queue
- Serialization at process boundaries
This bridge has a cost.
2. Multiple Processes ≠ GPU Parallelism
Adding worker processes doesn’t automatically improve GPU utilization when:
- One worker uses ~90% of GPU compute
- Insufficient remaining capacity for parallel work
- Sequential execution despite multiprocessing overhead
3. Queue Overhead Dominates
At 25 concurrent requests:
- vLLM translation time: ~400ms
- Total response time: 11,258ms
- Queue overhead: ~97% of total time
The majority of time was spent in queues and coordination, not computing.
4. Spiky GPU = Architectural Issue
- Consistent GPU utilization (e.g. 90-95%) indicates compute-bound workload
- Spiky pattern (93% → 0% → 93%) indicates the GPU is waiting for work—bottleneck is elsewhere (in our case, queues and IPC)
Conclusion
The bottleneck wasn’t GPU capacity. It was our multiprocessing architecture:
Issues identified:
- IPC overhead from queue serialization
- GPU compute contention without effective parallelism
- Async/await + multiprocessing coordination overhead
- Most latency from queues, not vLLM processing
Symptoms:
- Spiky GPU utilization
- Response time dominated by queue wait
- Adding workers made performance worse
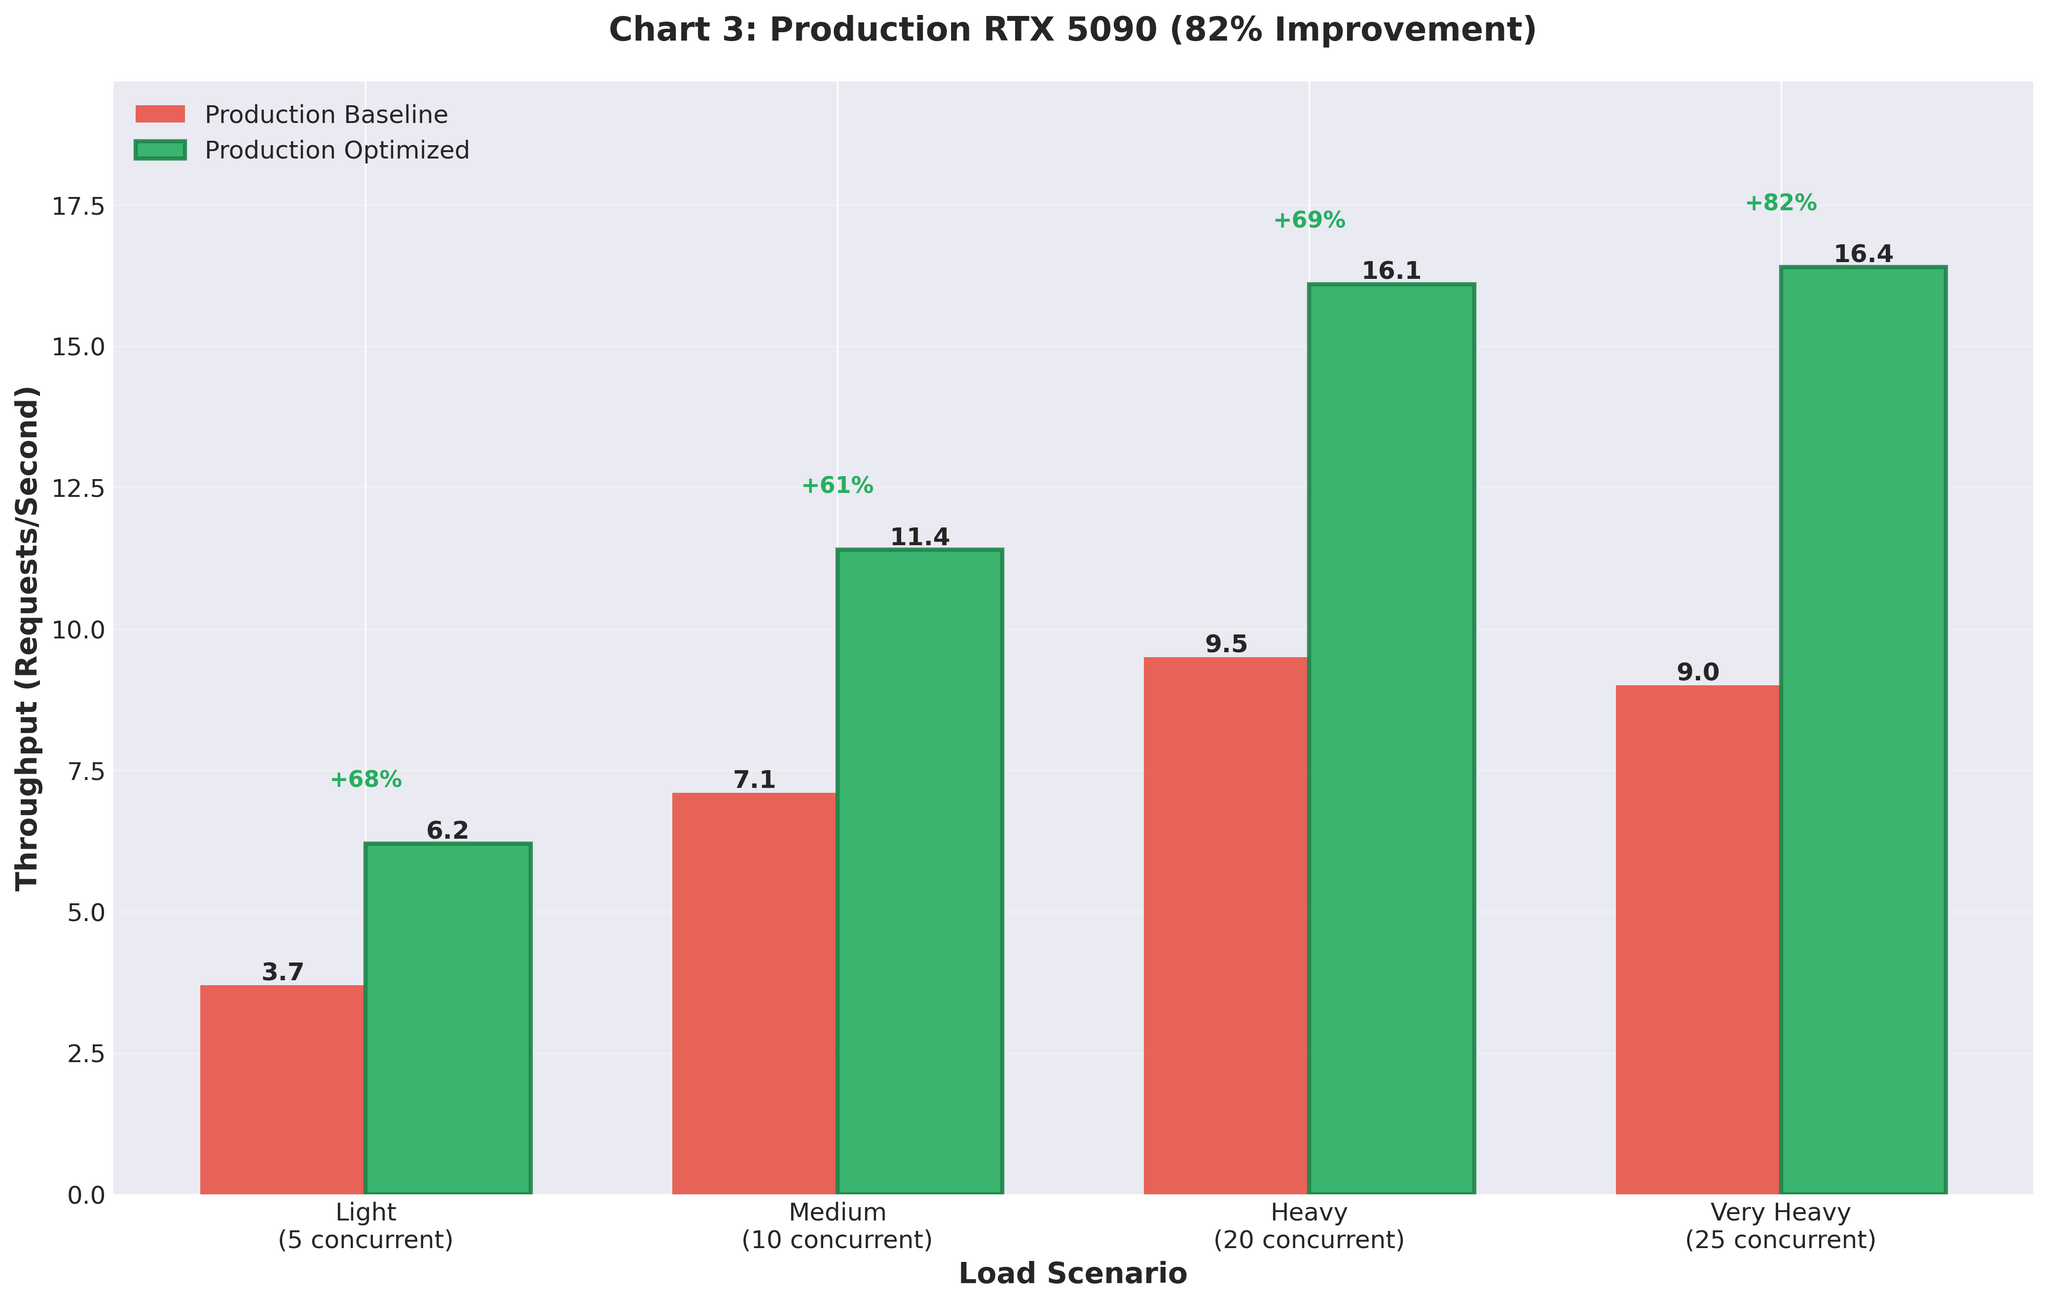
Note: In Part 2, we’ll cover the solution: eliminating multiprocessing, using vLLM’s AsyncLLMEngine directly, and achieving an 82% throughput improvement in production.
Preview:
- Remove multiprocessing architecture entirely
- Use vLLM’s AsyncLLMEngine with FastAPI directly
- Right-size continuous batching configuration
- Production result: Improved throughput (+82%)
Read next: Part 2: Scaling Translation Inference: +82% Throughput