In this article
The Result at a Glance
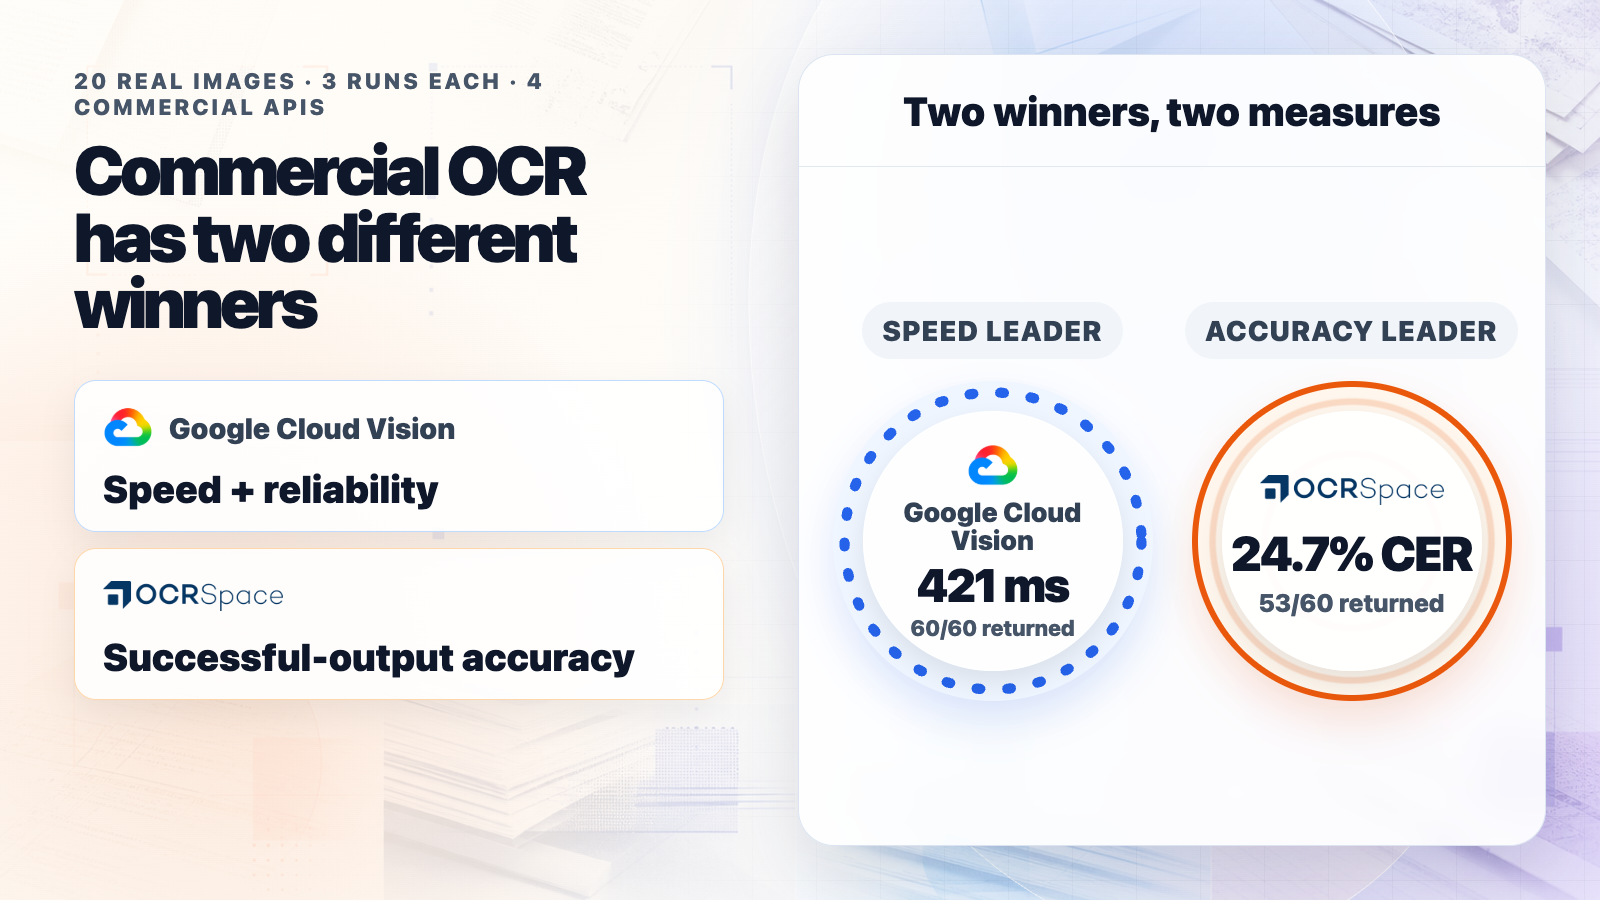
No provider won every dimension. Google Cloud Vision gave the strongest overall balance of speed and request reliability. OCR.Space returned the most accurate text when it completed a request. Azure completed every Korean request and matched the Korean menu reference exactly. Mistral OCR was the most document-oriented response format.
Google completed all 60 requests with a 421 ms median wall time. OCR.Space had the lowest normalized character error rate (CER) on successful outputs at 24.7%, but seven of its 60 original requests ended in HTTP 504 errors and its successful median was 7.6 seconds. Azure and Mistral also completed all 60 requests, with different strengths by language and document type.
Those trade-offs matter more than a single leaderboard rank. A service that returns excellent text but times out can be right for a paced batch job and wrong for an interactive workflow. A consistently fast service can be the better default even when another provider posts a lower error rate on the requests it completes.
Motivation for a Real-World OCR Benchmark
Clean Document Benchmarks Miss Real-World Challenges
OCR product pages often demonstrate clean pages: flat scans, high contrast, even lighting, and predictable reading order. Real images are less cooperative. Text arrives through angled photographs, faded historical documents, dense labels, small menus, curved packaging, mixed font sizes, tables, and formulas.
That difference is not cosmetic. A provider can perform well on born-digital pages and lose accuracy when perspective, illumination, or layout ambiguity enters the image. Public scores are useful context, but scores from different datasets are not a direct provider comparison.
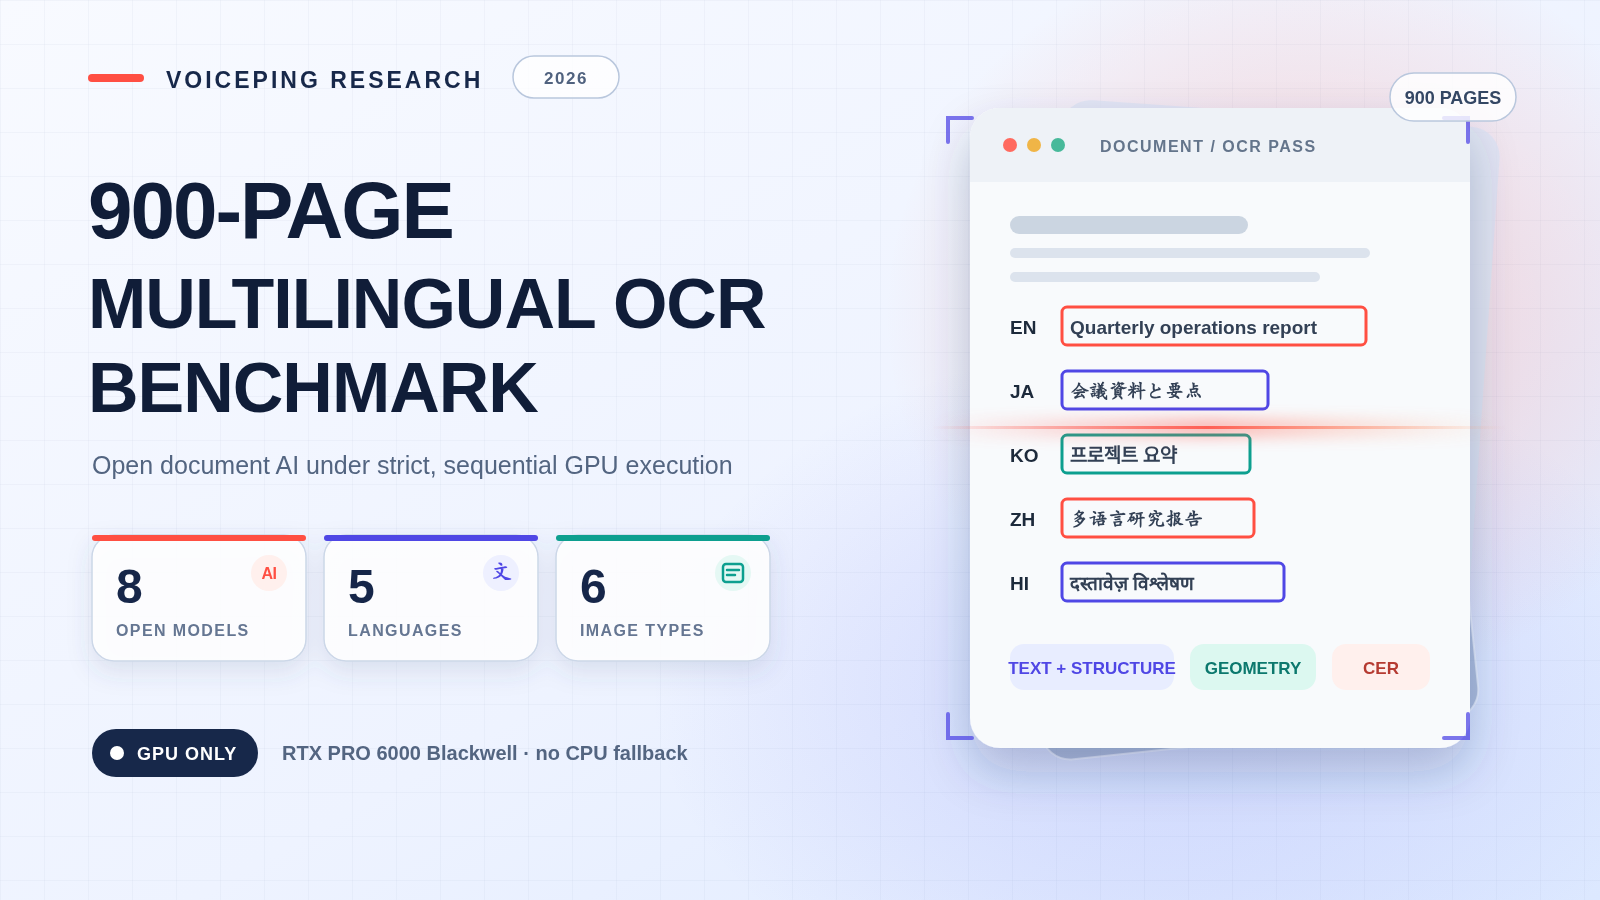
For a broader self-hosted baseline, VoicePing’s 900-page multilingual OCR benchmark compares eight open systems across five languages and six image types. This commercial-API study asks a narrower question: how do managed services behave on the same small set of difficult, real images?
The Questions Behind the Comparison
The benchmark focused on four practical questions: Which API responds quickly? Which one completes repeated requests consistently? Which one preserves the most text across English, Japanese, Korean, and Chinese? And do provider strengths change across tables, formulas, menus, packaging, and ordinary documents?
We also wanted to separate successful-output accuracy from request reliability. If failed requests simply disappear from an accuracy average, a provider can look stronger than the experience it actually delivers.
A Shared Dataset and Repeated-Run Design
We used 20 unique real images, each tested three times per provider. The same image bytes were sent to Google Cloud Vision , Azure AI Vision Read , Mistral OCR , and OCR.Space Engine 3 . That produced 60 measured requests per provider and 240 commercial-API requests in total.
The corpus covers four languages—English, Japanese, Korean, and Chinese—and five categories in each language:
- Tables
- Formulas and technical material
- Menus and signage
- Packaging and labels
- Documents and forms
The images are public-domain or openly licensed photographs and historical scans. Japanese references were independently rebuilt from the source pixels; the other references were consensus-assisted and visually reviewed. The study recorded OCR text, available bounding boxes, end-to-end wall time, provider errors, and repeat-to-repeat output fingerprints. The public CSV and JSON expose aggregates and per-run metrics, but not the full OCR outputs or reference transcripts; they allow aggregation checks, not complete reproduction of character-level scoring.
The main accuracy measure is normalized CER. It counts character substitutions, deletions and insertions against the reference after harmonizing Unicode, punctuation and whitespace; lower is better. CER can exceed 100% when there are many insertions, so 100% minus CER is not a literal percentage of correctly recognized characters. We also checked character overlap, line recall, digit error, bounding-box availability, median latency, p95 latency, and successful runs shown as x/60.
This is a deliberately small, diagnostic benchmark—not a universal ranking. Its advantage is control: every provider saw the same real images, with repeated runs and the same scoring code. The published downloads do not identify every fixed model version, API route, plan or concurrency setting, so these July 30, 2026 results should not be presented as measurements of today’s models or paid tiers.
The Full Comparison
Results Table
| Service | Successful runs | Mean CER | Median response time |
|---|---|---|---|
| 1. Google Cloud Vision | 60 / 60 | 30.8% | 421 ms |
| 2. Azure AI Vision Read | 60 / 60 | 40.2% | 542 ms |
| 3. Mistral OCR | 60 / 60 | 38.4% | 1.3 s |
| 4. OCR.Space Engine 3 | 53 / 60 | 24.7% | 7.6 s |
CER and latency summarize successful requests only. Mean CER averages the per-run values, rather than pooling all reference characters; OCR.Space’s CER excludes its seven HTTP 504 responses. The numbers in service names are presentation order, not performance ranks. That is why the result table keeps successful runs beside accuracy instead of hiding reliability in a footnote.
The download also includes a reliability-adjusted score. Treat it as an exploratory combined measure, not a replacement for the separate error, completion and latency figures above.
Accuracy by Category and Language
The aggregate result hides important workload differences. OCR.Space led documents, formulas, menus, and tables when it returned a result, while Google led packaging.
The language view changes the leaders again. Mistral posted the lowest Japanese CER; OCR.Space had the lowest successful-output CER for English, Korean and Chinese. For Korean, OCR.Space averaged 20.4% across 14 successful requests; Azure averaged 20.7% across all 15. Different completion counts and only five images per language prevent a broad language ranking.
| Service | English | Japanese | Korean | Chinese |
|---|---|---|---|---|
| 1. Google Cloud Vision | 29.2% (15/15) | 26.4% (15/15) | 33.7% (15/15) | 33.8% (15/15) |
| 2. Azure AI Vision Read | 37.9% (15/15) | 48.2% (15/15) | 20.7% (15/15) | 54.1% (15/15) |
| 3. Mistral OCR | 32.8% (15/15) | 24.7% (15/15) | 59.5% (15/15) | 36.5% (15/15) |
| 4. OCR.Space Engine 3 | 26.1% (15/15) | 26.9% (13/15) | 20.4% (14/15) | 25.6% (11/15) |
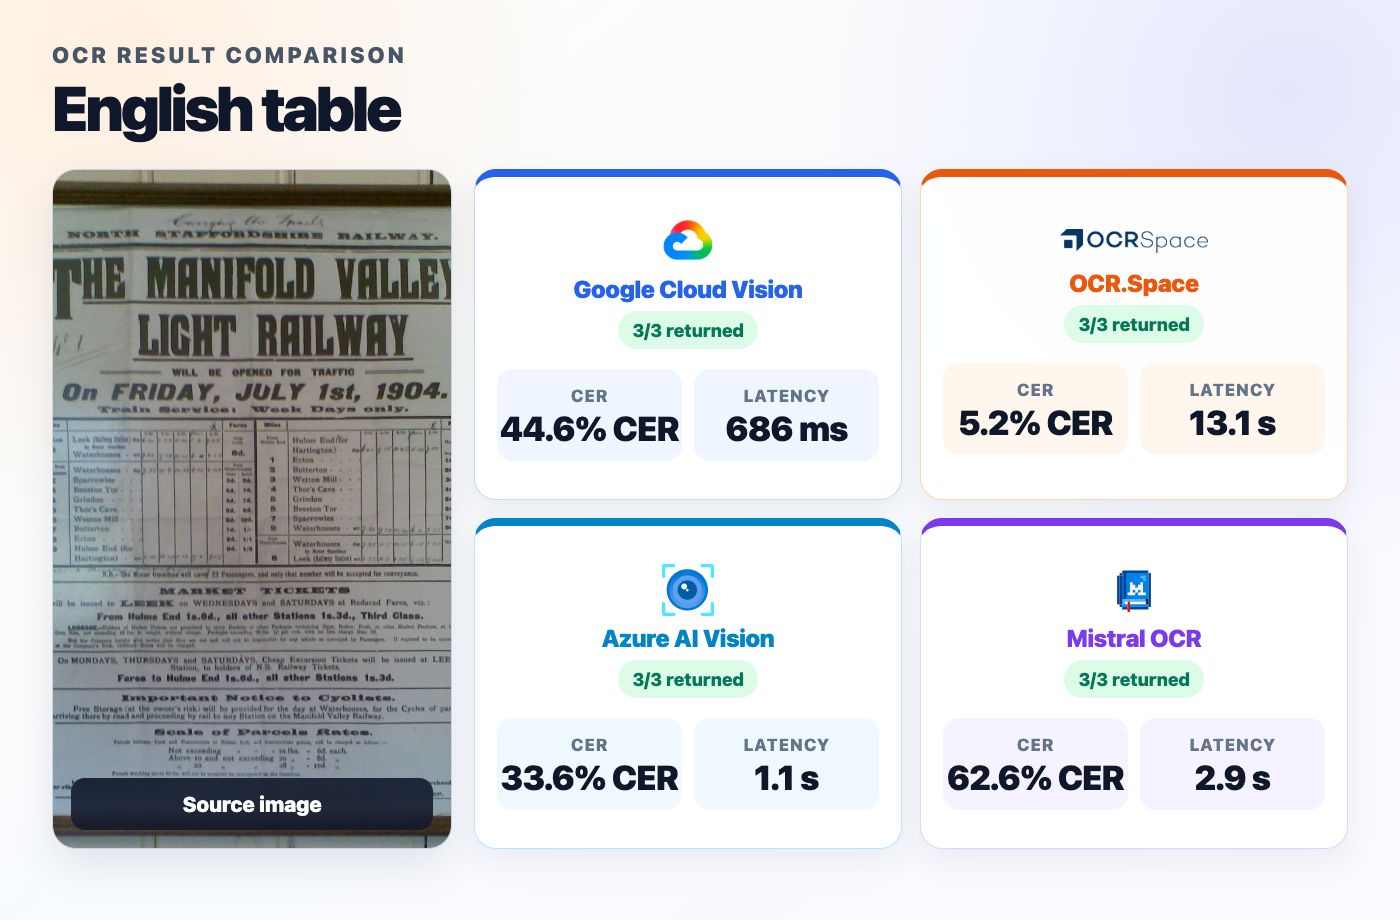
English table: accuracy versus latency
The example figures below show mean latency for each image, whereas the overall results use median latency. The historical English timetable is a useful example because every provider completed all three runs. OCR.Space was far more accurate on this image, but its average wall time was measured in seconds rather than milliseconds.
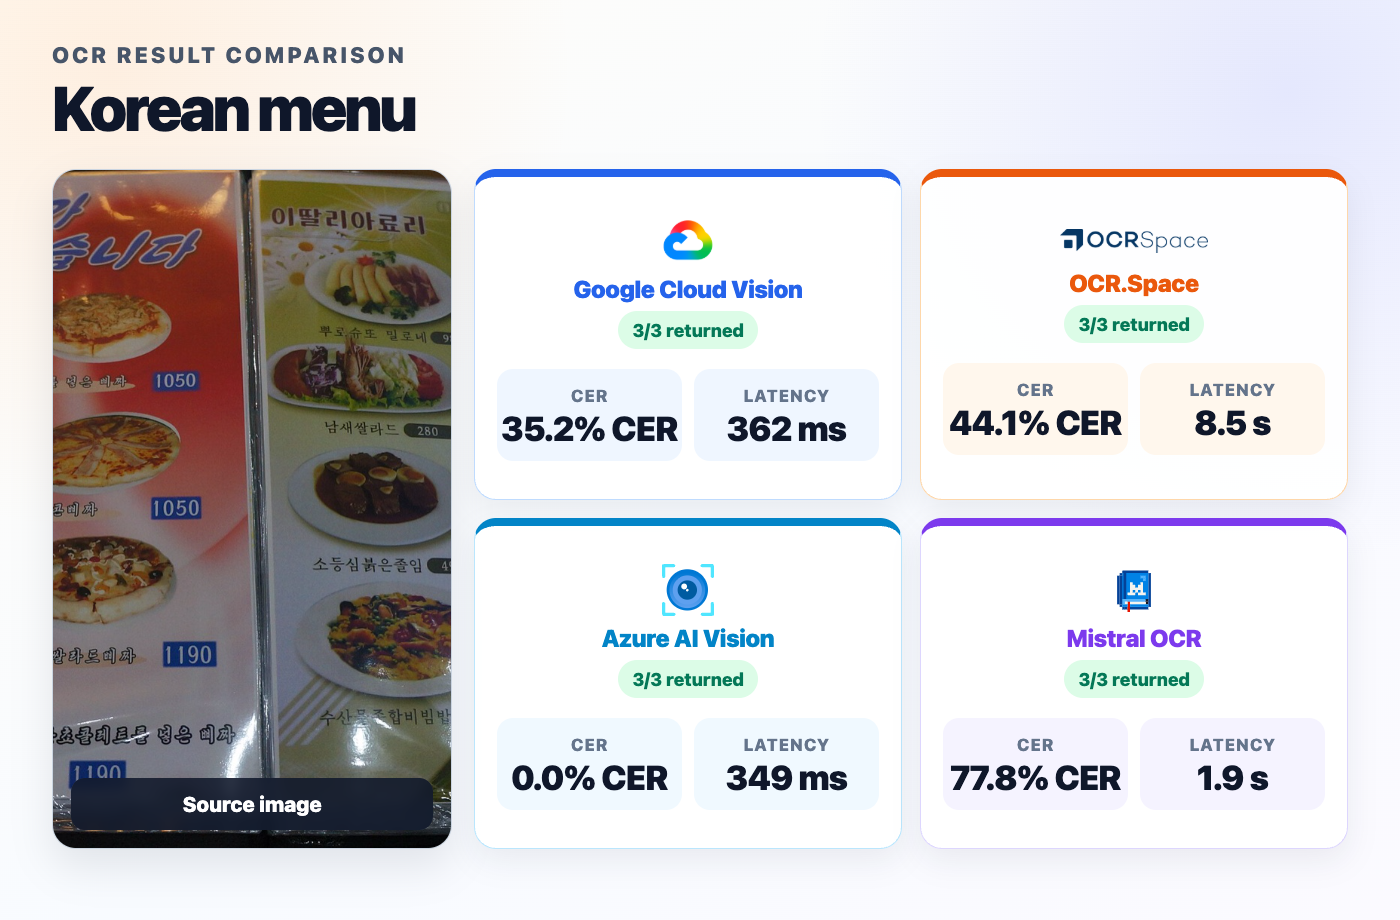
Korean menu: a language-specific reversal
Azure reproduced the reference exactly on the Korean menu across all three runs. The same provider did not lead the aggregate benchmark, which is precisely why a workload-specific view matters.
The Trade-Offs Behind the Numbers
The accuracy-versus-latency picture is unusually clear. Google and Azure completed all 60 requests with sub-second median latency. OCR.Space occupies the low-CER but high-latency region. Mistral is between those speed profiles, with output designed around document structure rather than a scene-text-first response.
OCR.Space’s seven original failures were server-side HTTP 504 responses. We retried the failed cases sequentially with a 180-second client timeout and paced requests. Three were recovered, while four still returned HTTP 504. The extended timeout helped, but it did not turn the service into a fully reliable path. Its original 60-attempt result remains the fair comparison because the other providers were not given a second scoring path.
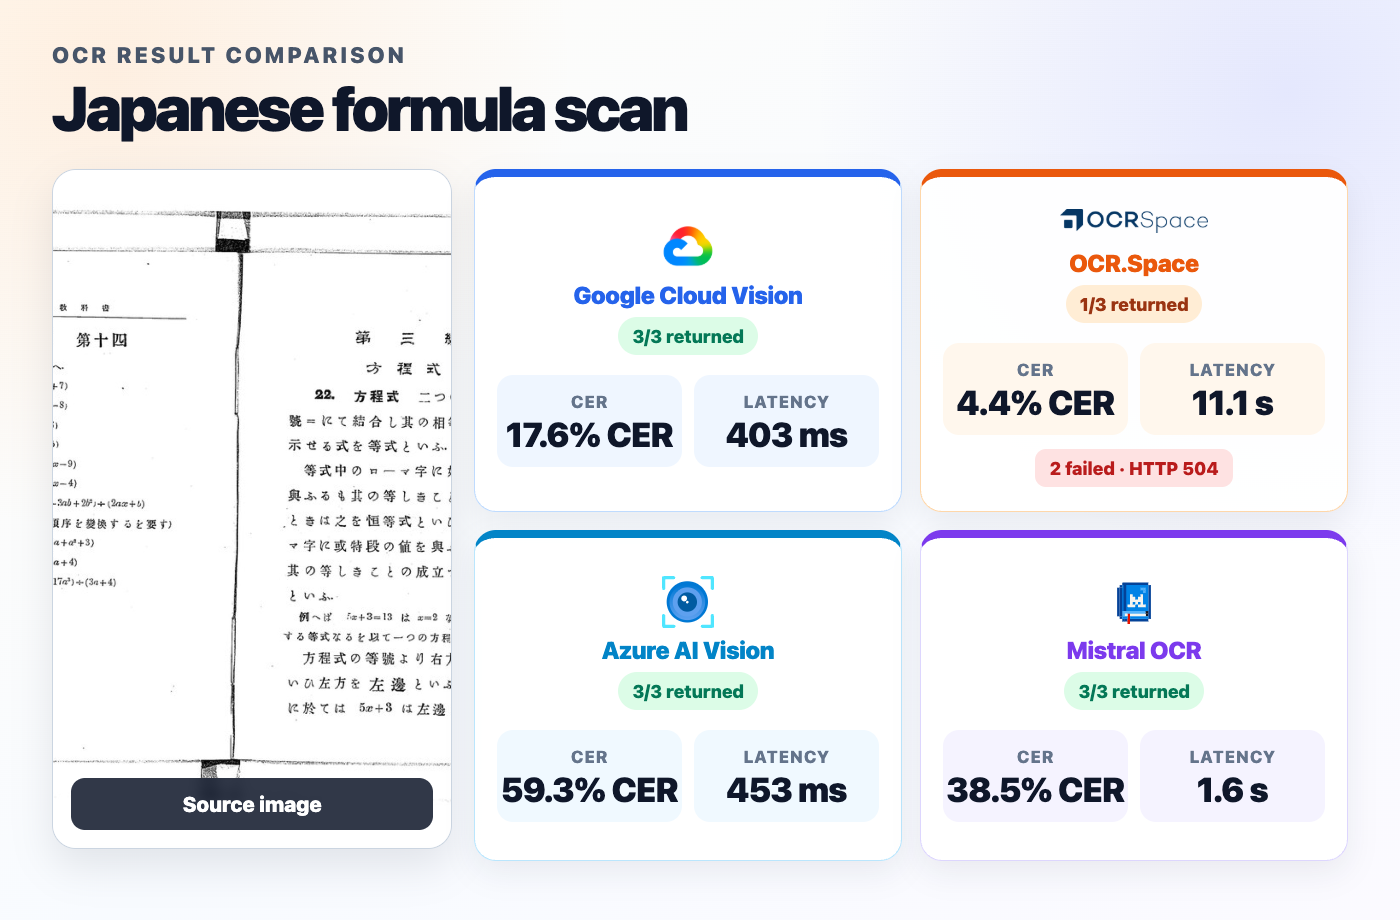
The Japanese formula image makes that distinction visible. OCR.Space produced the strongest text in its one successful original run, but two of the three attempts failed. Google completed all three quickly and with a still-strong result.
Local Results Versus Published Benchmarks
Published benchmarks support the idea that domain matters, but they cannot be pasted into the local table as if the test conditions were identical.
The VISTRA natural-image benchmark reports Google OCR at 18.0% CER on high-resolution English natural images. Google reached 29.2% English CER here. Our five English images include a dense railway table, blackboard formulas, packaging, a menu and a receipt. VISTRA also preserves case and punctuation when scoring, while this study normalizes them. The scores therefore do not measure a change in Google’s performance on the same task.
For document parsing, OmniDocBench includes 1,651 PDF pages and evaluates text, tables, formulas, layout, and reading order. Its published Mistral OCR row reports 0.097 text edit distance without establishing the same fixed model configuration as this study. Our Mistral documents/forms result was 7.0% CER, but the model version, input domain, aggregation, and metrics differ. The comparison is context, not an apples-to-apples win.
Real5-OmniDocBench reinforces the broader finding by reconstructing document pages under scanning, warping, screen photography, illumination, and skew. Its results show how sharply physical capture conditions can reduce document-parsing performance.
Microsoft documents the capabilities and language coverage of Azure Read OCR , but does not publish a directly comparable accuracy score for the exact endpoint, languages, and images tested here. OCR.Space describes Engine 3 as its accuracy-oriented option for tables, handwriting, and multilingual text, while also warning that it is slower and has lower quotas; our local result matches that qualitative trade-off.
API Pricing and Total Implementation Cost
These are current public list-price references, not costs measured during the July benchmark. Units and features differ, and taxes, currency conversion and negotiated discounts depend on billing arrangements.
| Service | Plan and billing unit | Price and included usage |
|---|---|---|
| 1. Google Cloud Vision | Text / Document Text Detection · pay as you go | First 1,000 units/month free; US$1.50 per 1,000 for units 1,001–5 million, then US$0.60 per 1,000. Each feature and document page counts separately. Official pricing |
| 2. Azure AI Vision Read | Read · F0 and paid Image Analysis Group 2 | Separate F0 tier: 5,000 transactions/month, 20/minute. Japan East paid retail: US$1.50 per 1,000 through 1 million, then US$0.60 per 1,000. Region/contract prices vary; F0 is not a paid-plan allowance. Official pricing |
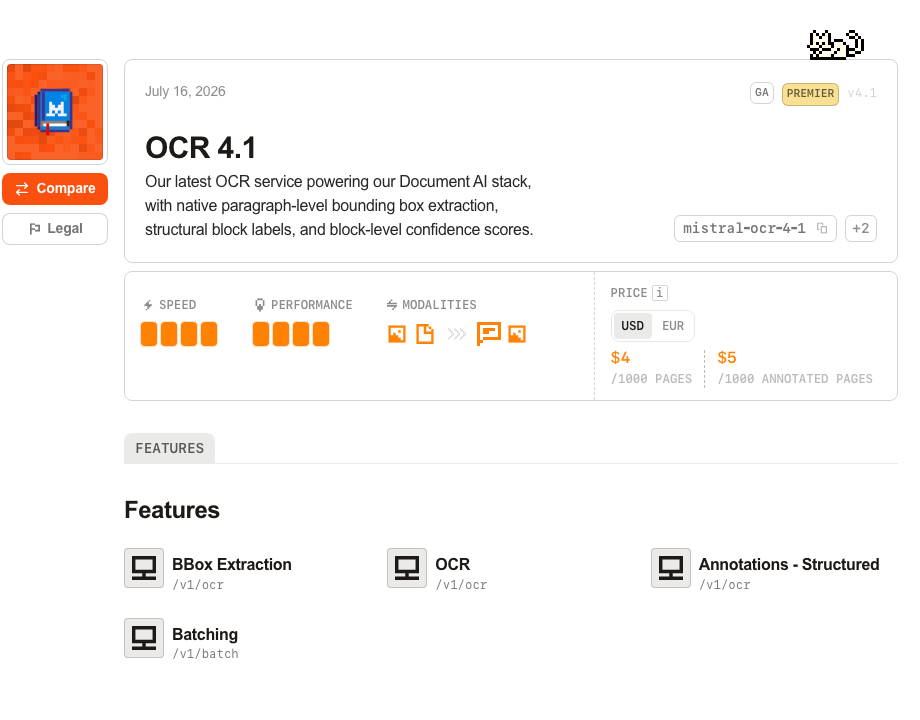
| 3. Mistral OCR | Current OCR 4.1 · per page | US$4 per 1,000 OCR pages; US$5 per 1,000 annotated pages. No continuing free page allowance confirmed on the model page. Official model and pricing |
| 4. OCR.Space Engine 3 | Engine 3 · Free / PRO / PRO PDF | Free: US$0, 2,500 Engine 3 conversions/month. Monthly PRO: US$30; PRO PDF: US$60; both include 30,000 Engine 3 conversions/month. These are monthly-billed prices, not annual-plan equivalents. Official plans and limits |
Azure’s Japan East rates were checked against its public retail API on September 19, 2026; the linked pricing page identifies Read as Group 2. Google and Azure charge per feature, and a multipage document can consume multiple units. Mistral’s current OCR 4.1 prices do not establish the version used in the original study. OCR.Space’s larger 25,000/300,000 monthly figures belong to Engines 1/2; Engine 3 has the smaller separate allocation above.
The cheapest list price is not automatically the lowest implementation cost. Retries, fallback requests, timeout handling, response normalization, monitoring, and engineering time all count. Mistral’s Markdown-oriented structure can save work for document ingestion. Google and Azure’s fast structured responses simplify interactive integrations. OCR.Space’s low effective unit price is attractive only when its latency and failure handling fit the workload.
Each Provider’s Strengths and Weaknesses
1. Google Cloud Vision: Speed and Completion
Google was the fastest provider in this benchmark and completed all 60 requests. It completed every request, delivered the fastest median among the services that completed all 60 requests, returned bounding boxes on every successful run, and stayed competitive across all four languages and five categories.
Its weakness is equally important: Google did not have the lowest successful-output CER. OCR.Space returned more accurate text on average when it responded, and Azure beat Google on Korean here. Google’s advantage is the balance, not dominance of every cell.
2. Azure AI Vision Read: Fast Responses and Text Geometry
Azure also completed 60/60 requests and remained close to Google on latency. It matched the Korean menu reference in all three runs. Across all five Korean images, its 20.7% mean CER was slightly higher than OCR.Space’s 20.4%, while Azure completed 15/15 requests and OCR.Space completed 14/15. Its word and line geometry was straightforward to normalize.
For new integrations, Microsoft’s migration notice
matters: Image Analysis’s /imageanalysis endpoint, versions 3.2 and 4.0, retires on September 25, 2028. This is not a retirement notice for all Azure OCR or Document Intelligence. Confirm the endpoint and migration path before implementation.
The aggregate CER was higher than Google’s and OCR.Space’s successful-output result. Japanese and Chinese complex layouts were the main drag. On the Japanese material, much of the CER gap came from reading order rather than missing characters, which is why Azure’s character-overlap score remained much stronger than its CER alone suggests.
3. Mistral OCR: Structured Document Output
Mistral completed every request and returned identical normalized text across all three runs for every image. It was strongest on documents/forms and formulas, and its Markdown, table, and document structure are useful when OCR feeds a document-ingestion pipeline.
The current document-processing API returns structured page content. The public files do not establish whether the July test used OCR 4.1; this update does not claim a fresh run of that model.
This is a specialized fit, not a claim that Mistral had the lowest document CER. Google and OCR.Space were more accurate on documents/forms in the aggregate. Mistral’s advantage is the document-native representation and repeatable structured output. It was slower than Google and Azure, and scene-like menus and packaging were substantially harder.
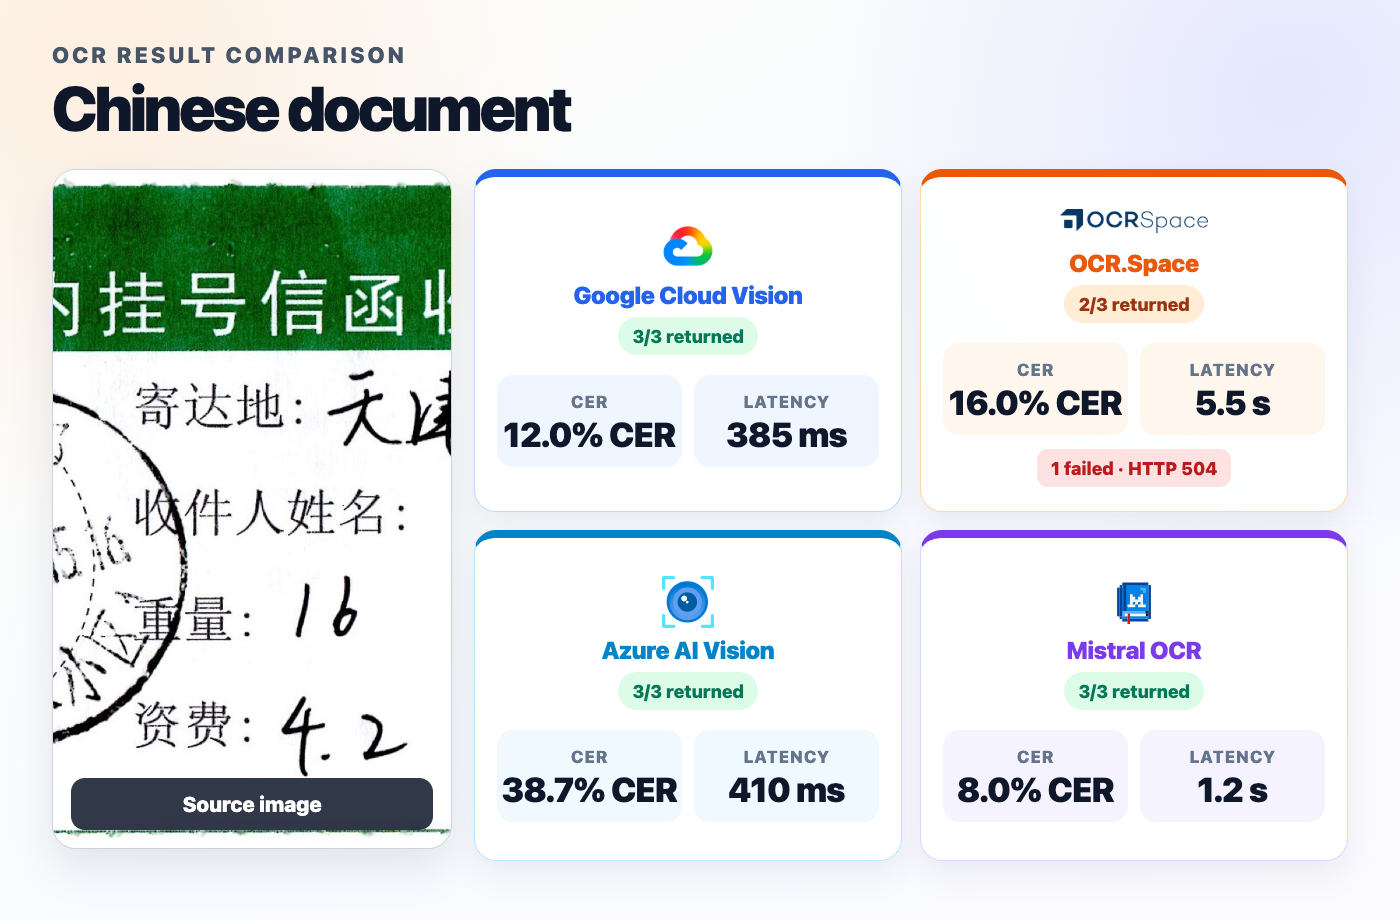
The Chinese form illustrates that narrower strength: Mistral was the most accurate provider on this image, while all four outputs still reveal different reading-order and punctuation choices.
4. OCR.Space Engine 3: Accuracy With Longer Waits
OCR.Space produced the lowest successful-output CER in the benchmark and was particularly competitive on documents/forms, tables, and formulas. Engine 3 also returned table-aware Markdown in cases where a plain line list would lose structure.
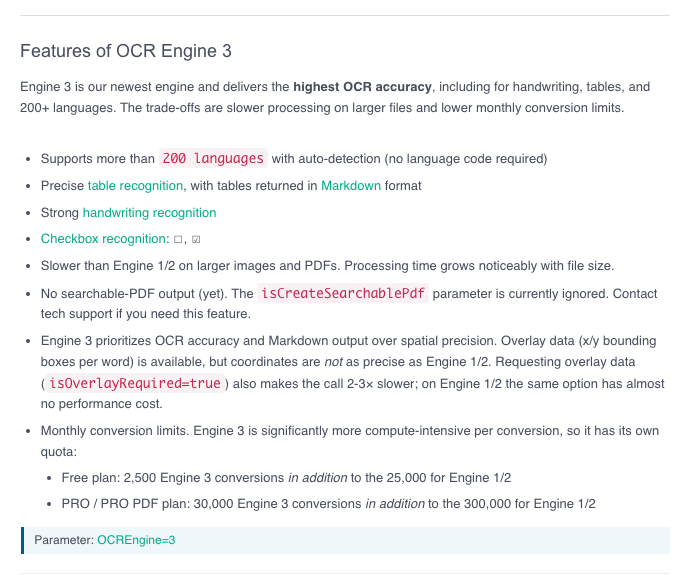
Current Engine 3 documentation describes multilingual, table and handwriting support, but no searchable-PDF output. It also warns about slower processing and smaller monthly quotas than Engines 1/2.
The trade-off in the historical test was operational. Seven original requests failed with HTTP 504, only 75% of images completed all three attempts, and the successful median was 7.6 seconds. Even after paced retries with a longer client timeout, four failures remained. OCR.Space is compelling when accuracy can justify waiting and retrying; it is a risky sole dependency for a latency-sensitive path.
Practical Takeaways
Patterns by Workload
- Choose Google Cloud Vision when you need the strongest overall combination of speed, reliability, multilingual coverage, and bounding boxes.
- Evaluate Azure AI Vision Read when text geometry and a fast alternative matter, using your own Korean documents and a checked migration plan for the selected endpoint.
- Choose Mistral OCR when the input is document-like and Markdown, tables, and document structure are more valuable than the fastest response.
- Consider OCR.Space Engine 3 when successful-output accuracy matters more than latency and the workflow can handle retries or manual fallback.
These are workload recommendations from this dataset, not permanent labels. API versions, paid tiers, regions, image preprocessing, and provider updates can all shift the outcome.
Limits and the Next Benchmark
The dataset has only 20 images, with three attempts per provider-image pair. That is enough to expose major latency, reliability, and domain differences, but not enough to estimate performance for every script, camera condition, or document family.
The references are also not uniformly professional transcriptions. Japanese was independently rebuilt from source pixels; the other 15 images were consensus-assisted and visually reviewed. References assisted by a provider’s output may favor that provider. The separate reference-sensitivity audit excludes different image subsets for different providers, so it cannot be used as a matched re-ranking.
A stronger follow-up should include more natural photographs, controlled blur and low light, rotation and perspective, mixed-language images, handwriting, dense multi-column pages, paid-tier behavior, and controlled concurrency. It should also report both reading-order-sensitive CER and order-tolerant character overlap so layout errors are not mistaken for missing text.
Conclusion
The central result is a trade-off, not a universal winner. Google Cloud Vision delivered the best speed-and-reliability balance. OCR.Space returned the most accurate successful text. Azure completed all Korean requests and matched the menu reference exactly. Mistral offered the most document-oriented output.
For most general OCR integrations, Google is the clearest default from this benchmark. The other three remain valuable when a specific language, response format, or accuracy-first batch workflow matters more than the overall balance.
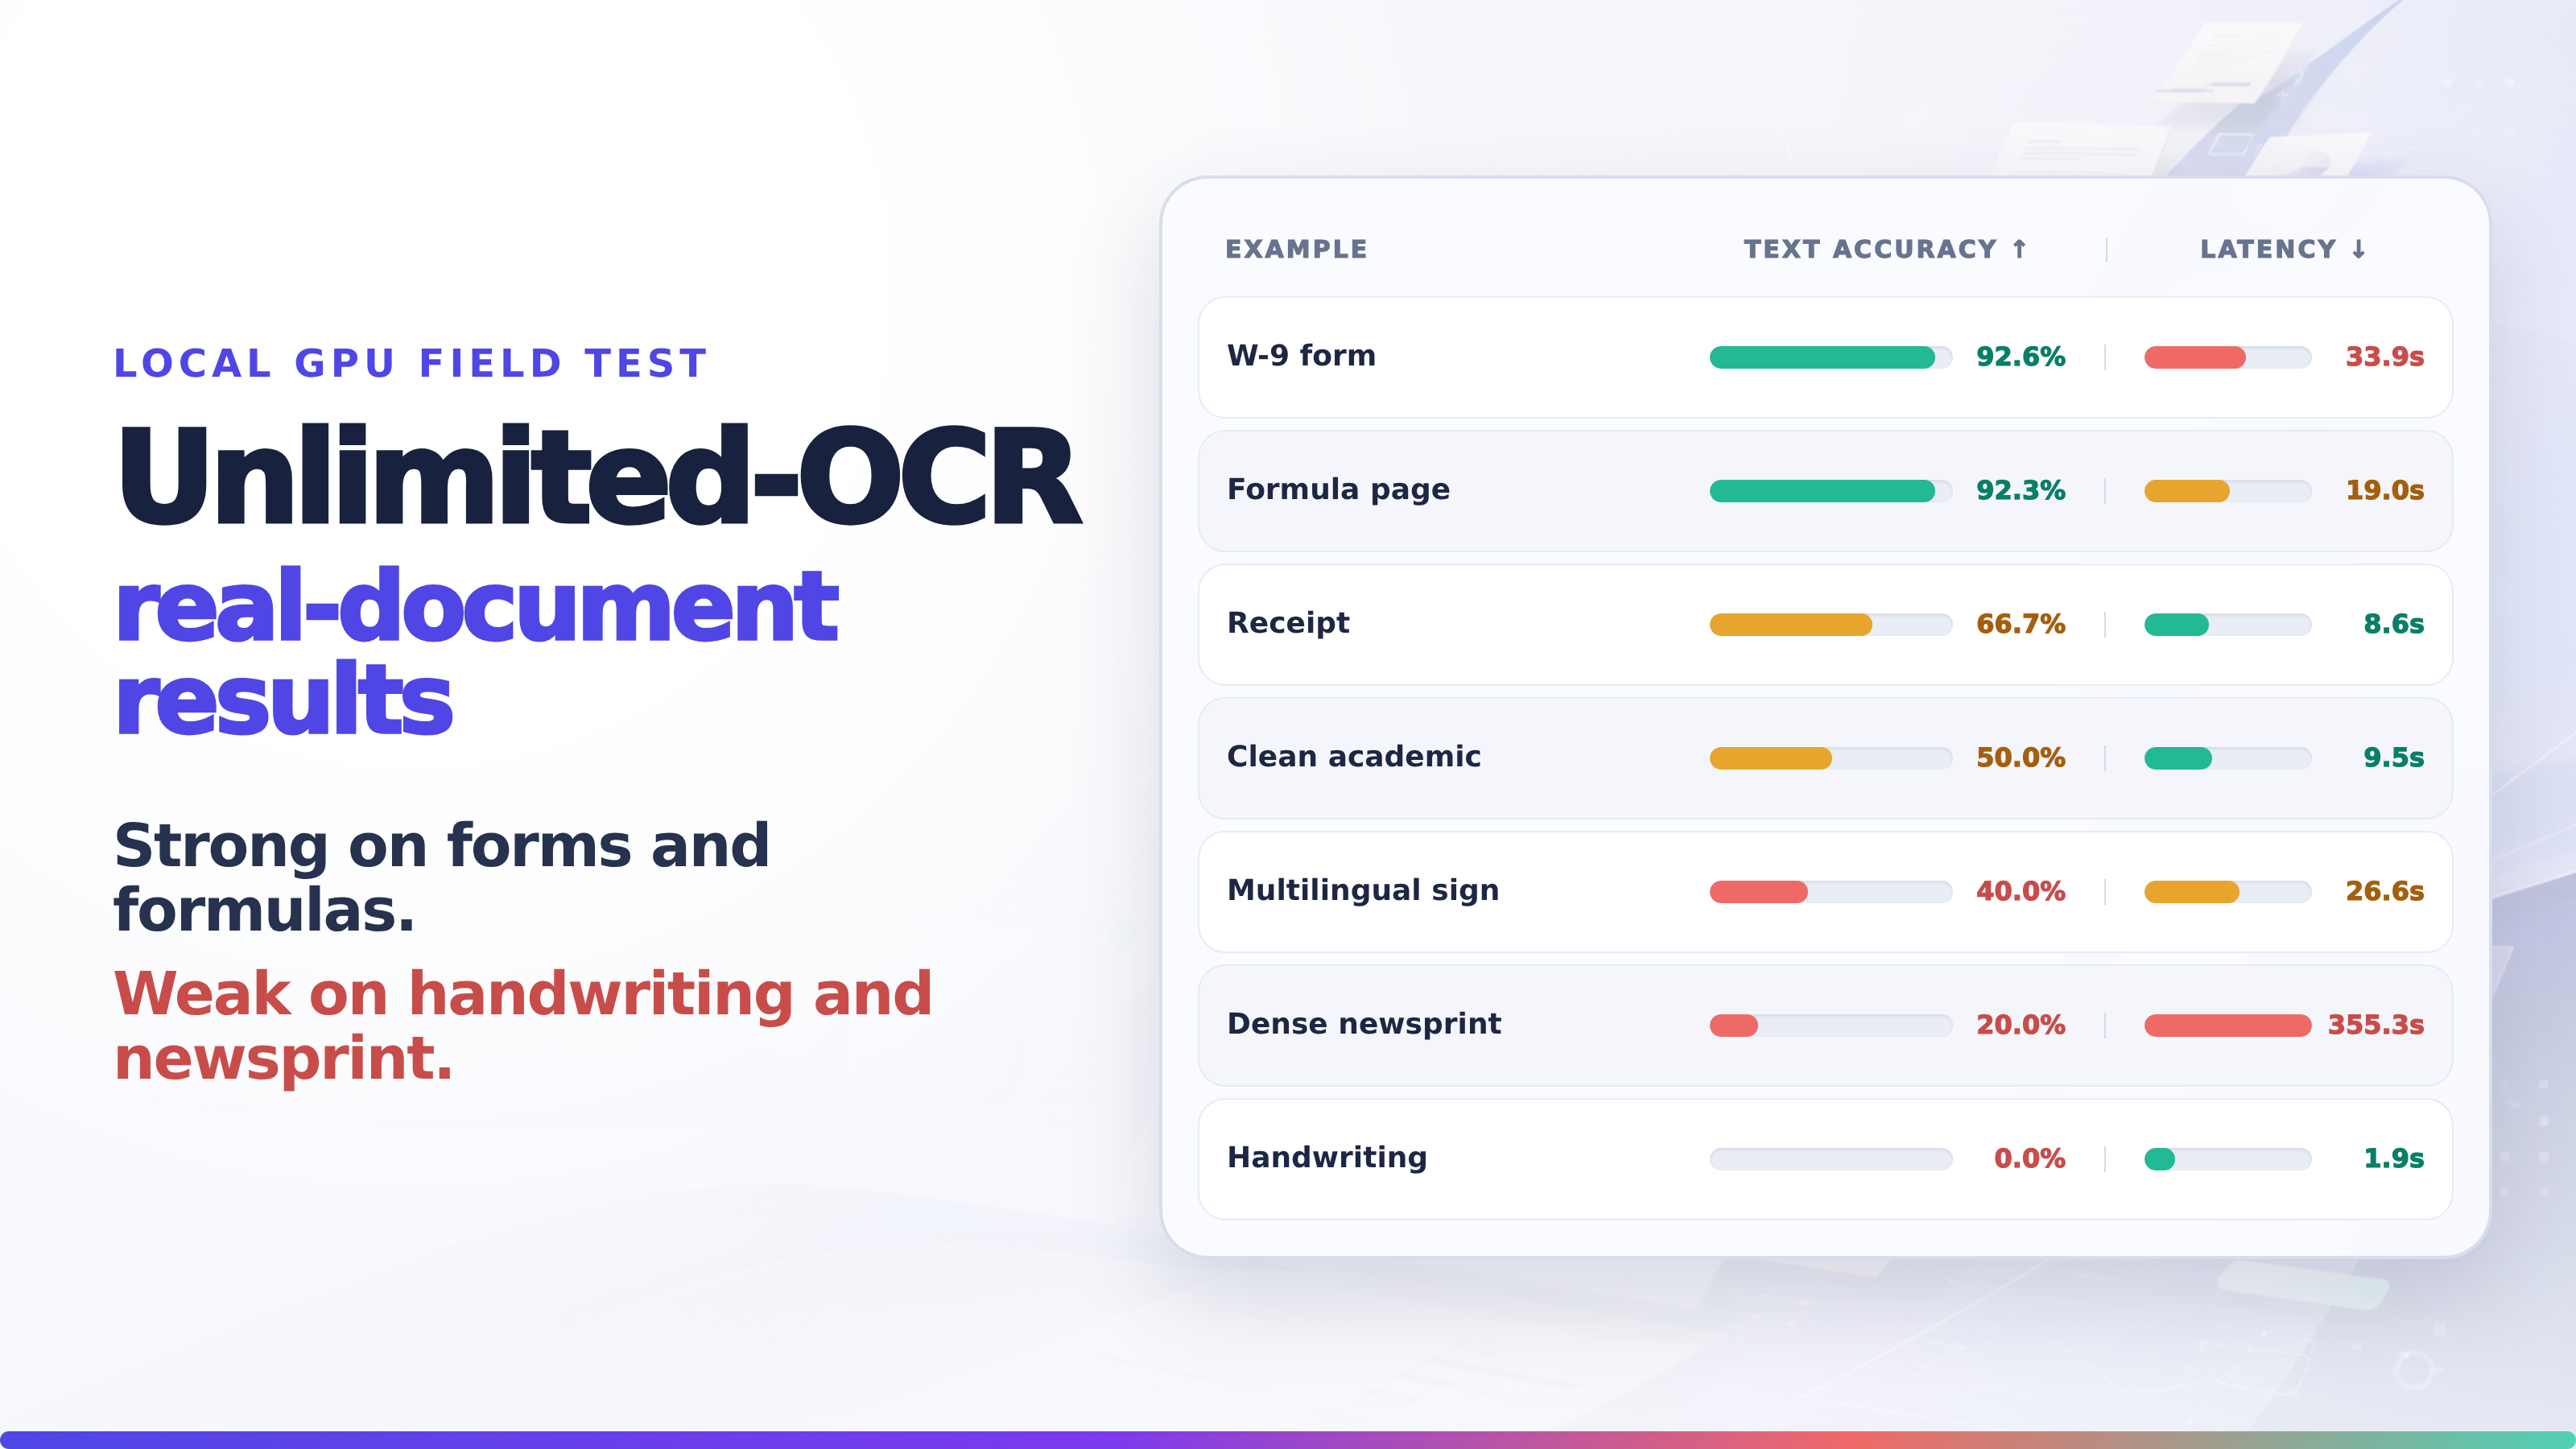
If infrastructure control matters more than a managed endpoint, compare these results with VoicePing’s Unlimited-OCR real-document field test , which shows how a local GPU model’s strengths and failures change across forms, formulas, handwriting, and newsprint.
For audio and video rather than images, VoicePing’s transcription and translation workflow addresses a different input type; VoicePing is not one of the four OCR APIs measured here.
Download the benchmark’s commercial-only summary JSON and per-run CSV , or review the source-image licenses and provenance . The downloadable files contain only the four commercial APIs discussed in this article.